How to Configure Zabbix for Server Monitoring?
Zabbix is a popular tool for monitoring servers and networks. It allows you to track server status, monitor load and performance, and notify administrators of potential issues. In this article, we’ll explore how to configure Zabbix for server monitoring.
First, you need to install Zabbix on the server. To do this, follow these steps:
sudo apt-get update— update the package listsudo apt-get install zabbix-server-mysql zabbix-frontend-php— install the necessary packagessudo mysql -uroot -p— log in to MySQLcreate database zabbix character set utf8 collate utf8_bin;— create a database for Zabbixgrant all privileges on zabbix.* to zabbix@localhost identified by 'password';— configure the user for the databasequit;— exit MySQL
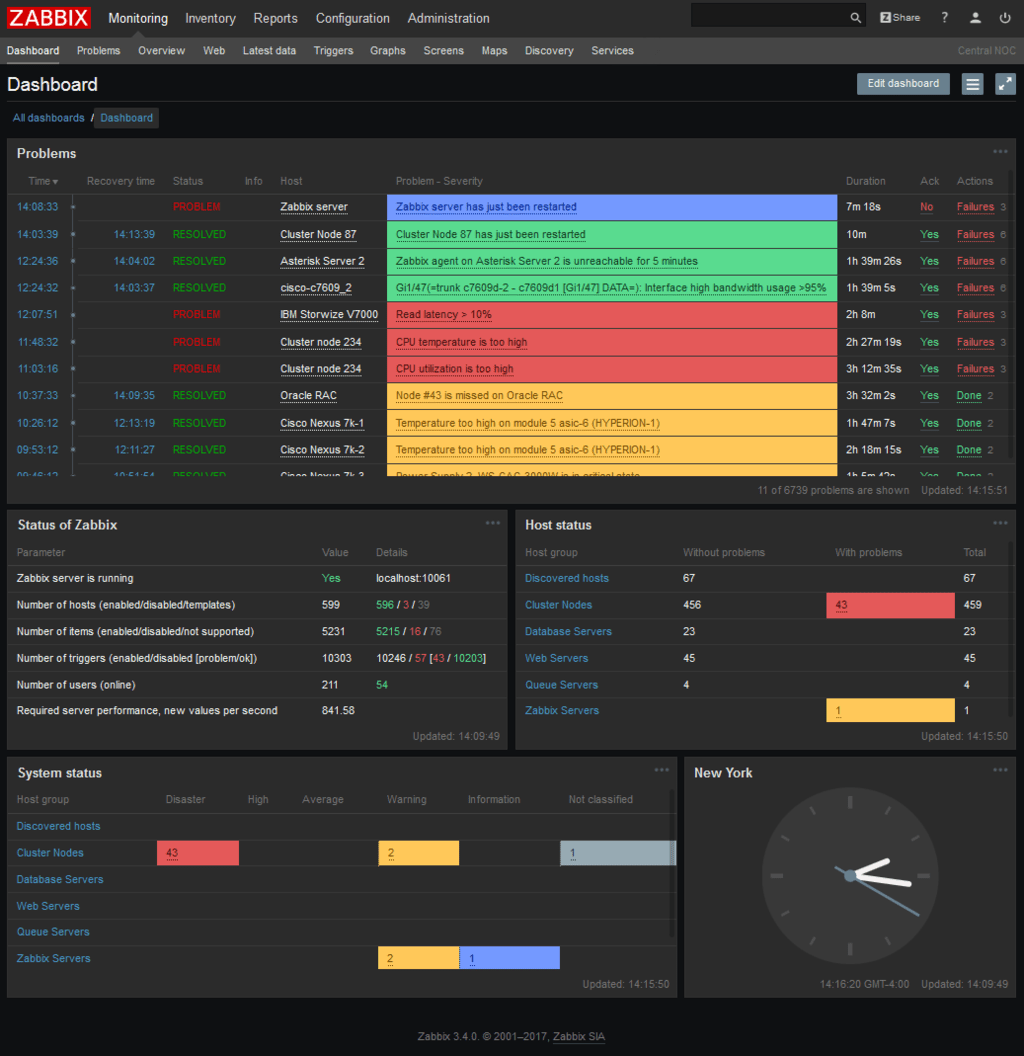
After installation, you need to configure Zabbix for server monitoring. Go to the Zabbix web interface (usually at http://ip-address/zabbix) and perform the following steps:
Admin -> Configuration -> Hosts -> Create host— create a new hostName— enter the server nameGroups— select a group for the server
Agent interfaces — specify the server’s servers with IP addresses
Templates— link monitoring templates
After configuring the host, you need to configure monitoring of server parameters. To do this, follow these steps:
Admin -> Configuration -> Hosts -> select your hostItems -> Create item— create a new monitoring itemName— enter the parameter nameType— select the monitoring type (e.g., CPU, Memory, Disk usage)Key— specify the key for monitoring (e.g., system.cpu.load, vm.memory.size[available], vfs.fs.size[/])Update interval— specify the update interval
After configuring the server monitoring parameters, save the changes and wait for data collection. Now you can track the server status, monitor load and performance, and take measures to address identified problems.
Remember to regularly update and configure Zabbix for effective server monitoring. If you encounter problems, refer to the Zabbix documentation or the user community for assistance.