Розгортання Grafana Loki для централізованого логування на VPS: Promtail, Nginx, Systemd
TL;DR
У цьому детальному посібнику ми крок за кроком налаштуємо централізовану систему збору та аналізу логів на вашому VPS, використовуючи стек Grafana Loki. Ви навчитеся встановлювати та конфігурувати Loki для зберігання логів, Promtail для їх збору з ваших застосунків, і Nginx як зворотний проксі з HTTPS для безпечного доступу. В результаті ви отримаєте потужне та масштабоване рішення для ефективного моніторингу подій на вашому сервері та застосунках.
- Встановлення Grafana Loki та Promtail як служб Systemd.
- Налаштування Nginx як зворотного проксі для Loki з підтримкою HTTPS через Certbot.
- Конфігурація Promtail для збору логів з різних джерел та відправлення їх у Loki.
- Забезпечення безпечного доступу до Loki UI через Nginx та TLS.
- Покрокова інструкція з підготовки сервера, встановлення, налаштування, резервного копіювання та усунення несправностей.
Що ми налаштовуємо і навіщо
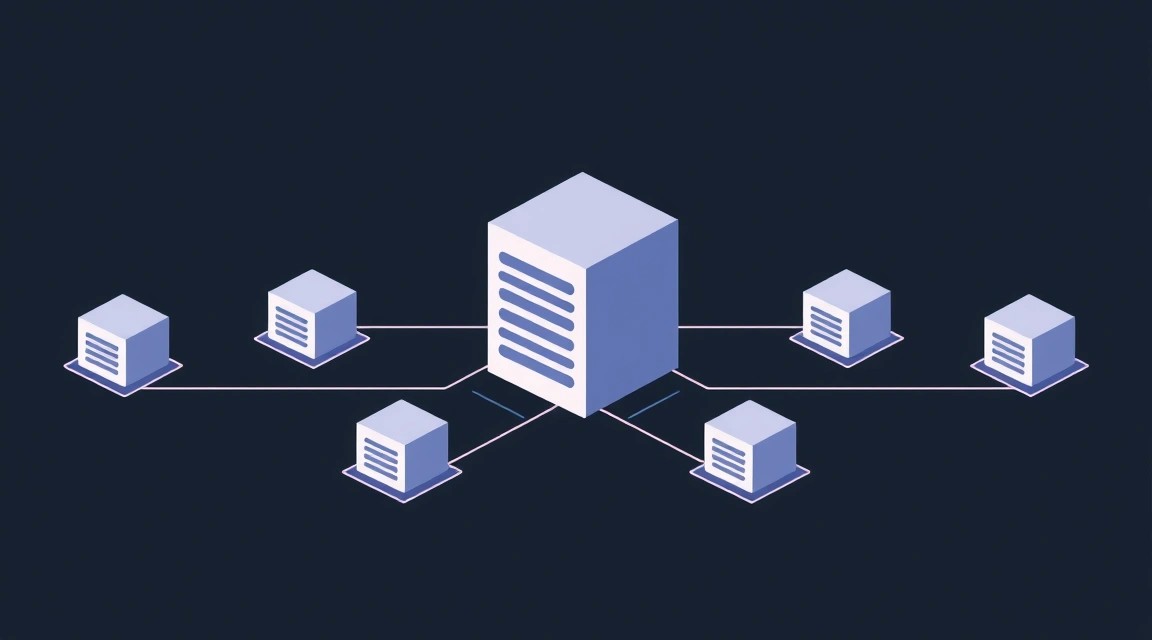
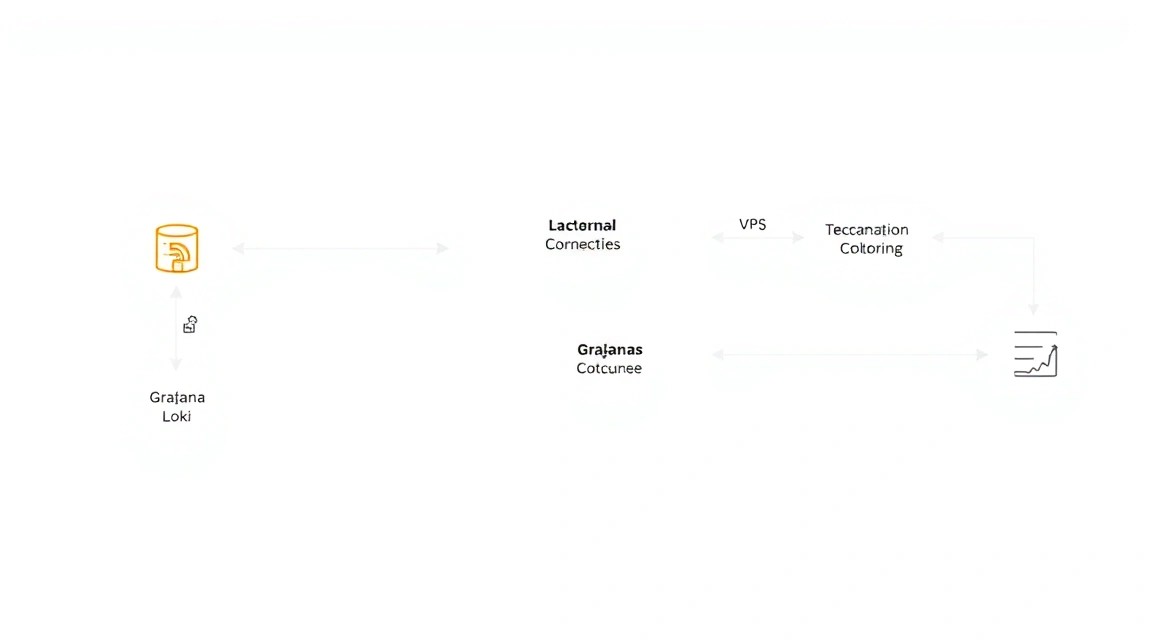
У сучасному світі, де застосунки та сервіси генерують величезні обсяги даних, централізоване логування стає не просто зручністю, а необхідністю. Ми будемо розгортати Grafana Loki — горизонтально масштабовану, високодоступну, мультиорендну систему агрегації логів, розроблену Grafana Labs. Loki відрізняється від інших систем логування тим, що індексує лише метадані (лейбли) логів, а самі логи зберігає у стислому вигляді. Це робить його дуже ефективним з точки зору використання ресурсів та вартості зберігання.
У рамках цього туторіалу ми налаштуємо повний стек для централізованого збору, зберігання та доступу до логів:
- Grafana Loki: Ядро системи, яке приймає логи, індексує їх за лейблами та зберігає.
- Promtail: Агент, який встановлюється на кожен сервер, де генеруються логи. Він відстежує вказані файли логів, застосовує до них лейбли та відправляє їх у Loki.
- Nginx: Виступатиме в ролі зворотного проксі для Loki, забезпечуючи безпечний доступ через HTTPS та можливість хостити Loki на стандартних портах.
- Systemd: Ми будемо використовувати Systemd для керування службами Loki та Promtail, забезпечуючи їх автоматичний запуск та моніторинг.
У підсумку, читач отримає повністю робочу систему централізованого логування. Це дозволить збирати логи з усіх ваших застосунків та сервісів на VPS (або кількох VPS), переглядати їх у зручному інтерфейсі Grafana (яку можна підключити до Loki), швидко знаходити потрібні події, налагоджувати проблеми та моніторити стан системи. Це значно спрощує керування інфраструктурою, особливо коли у вас кілька сервісів або мікросервісів, розгорнутих на одному або різних серверах.
Альтернативи: Cloud-managed vs. Self-hosted на VPS
Існує кілька підходів до централізованого логування:
- Cloud-managed сервіси (SaaS): Такі платформи, як Datadog, Splunk Cloud, Logz.io, AWS CloudWatch, Google Cloud Logging, Azure Monitor. Вони пропонують готові рішення з мінімальним налаштуванням, високою доступністю, масштабованістю та багатим функціоналом. Плюси: Простота використання, не потрібно керувати інфраструктурою, потужні аналітичні інструменти. Мінуси: Висока вартість, особливо при великих обсягах логів; потенційні питання конфіденційності даних, оскільки логи зберігаються у стороннього провайдера; менший контроль над інфраструктурою.
- Self-hosted рішення на виділеному сервері/VPS: Це підхід, який ми реалізуємо з Loki. Ви повністю контролюєте всю систему, від інфраструктури до конфігурації. Плюси: Повний контроль над даними та безпекою, потенційно значно менша вартість при великих обсягах логів (плата лише за VPS/dedicated), гнучкість у налаштуванні під специфічні потреби. Мінуси: Вимагає технічних знань для розгортання та обслуговування, відповідальність за доступність та масштабування лежить на вас.
Вибір self-hosted рішення на VPS з Loki особливо актуальний для власників VPS, розробників, соло-фаундерів та ентузіастів, які хочуть мати повний контроль над своєю інфраструктурою, оптимізувати витрати та не залежати від сторонніх хмарних провайдерів. Loki, завдяки своєму дизайну, є чудовим вибором для цього завдання, оскільки він менш вимогливий до ресурсів порівняно з іншими системами, такими як ELK-стек (Elasticsearch, Logstash, Kibana), особливо в плані споживання оперативної пам'яті та дискового простору за рахунок індексації лише метаданих.
Який VPS-конфіг потрібен для цього завдання
Вибір відповідного VPS для Grafana Loki залежить від обсягу логів, які ви плануєте збирати, та терміну їх зберігання. Loki ефективно стискає логи, але все одно вимагає достатнього дискового простору та помірних ресурсів CPU/RAM для індексації та запитів.
Мінімальні вимоги для Loki та Promtail (для невеликих проєктів, до 100 ГБ логів на місяць)
- CPU: 2 ядра. Loki та Promtail не сильно навантажують процесор у режимі очікування, але пікові навантаження при індексації або складних запитах можуть вимагати більше.
- RAM: 4 ГБ. Loki може бути досить вимогливим до пам'яті при великих обсягах запитів або тривалому зберіганні індексів у пам'яті. Promtail споживає мало.
- Диск: NVMe SSD від 100 ГБ. Швидкість диска критична для запису логів та виконання запитів. Обсяг залежить від обсягу логів та політики їх зберігання. Для 100 ГБ логів на місяць та зберігання за 3 місяці знадобиться близько 300 ГБ.
- Мережа: 100 Мбіт/с. Для передачі логів від Promtail до Loki та доступу до UI.
Рекомендований VPS-план для середніх проєктів (до 500 ГБ логів на місяць, кілька джерел)
Для більш серйозних завдань, де ви збираєте логи з кількох застосунків або серверів, і очікуєте до 500 ГБ логів на місяць, слід розглянути потужнішу конфігурацію:
- CPU: 4 ядра.
- RAM: 8 ГБ.
- Диск: NVMe SSD від 500 ГБ до 1 ТБ.
- Мережа: 1 Гбіт/с.
Такий план забезпечить достатню продуктивність для обробки запитів та зберігання більшого обсягу даних. Ви можете розглянути VPS із зазначеними характеристиками для розгортання вашої системи централізованого логування.
Коли потрібен dedicated, а не VPS
Виділений сервер (dedicated server) стає кращим, коли:
- Дуже великі обсяги логів: Якщо ви плануєте збирати терабайти логів на місяць (наприклад, з великого кластера Kubernetes або безлічі мікросервісів).
- Висока продуктивність запитів: Потрібен миттєвий доступ до логів та виконання складних аналітичних запитів на величезних масивах даних.
- Гарантовані ресурси: Вам потрібні 100% гарантовані ресурси CPU, RAM та диска, без "сусідського" ефекту, який іноді зустрічається на VPS.
- Суворі вимоги до зберігання: Необхідність у масивах RAID для підвищення надійності дискової підсистеми або специфічні вимоги до типу дисків (наприклад, високопродуктивні HDD для архівного зберігання логів, спільно з SSD для гарячих даних).
- Фізична ізоляція: Для дотримання суворих норм безпеки та відповідності (наприклад, PCI DSS, HIPAA), де потрібна повна фізична ізоляція.
Для більшості індивідуальних розробників, соло-фаундерів та малих команд VPS буде більш ніж достатньо та економічно вигідніше. Однак, якщо ви бачите, що ваш обсяг логів перевищує 1-2 ТБ на місяць, або продуктивність VPS починає страждати, перехід на відповідний dedicated буде виправданий.
Локація VPS: на що впливає
Вибір локації VPS впливає на кілька ключових аспектів:
- Затримка (Latency): Чим ближче VPS до джерел логів (ваших інших серверів, клієнтів застосунків), тим нижча затримка при передачі логів. Це важливо для оперативного моніторингу та зниження мережевого навантаження.
- Відповідність законодавству: У деяких юрисдикціях існують суворі вимоги до зберігання даних, включаючи логи. Переконайтеся, що обрана локація відповідає застосовним законам про конфіденційність даних (наприклад, GDPR в Європі).
- Вартість: Ціни на VPS можуть відрізнятися залежно від регіону.
- Доступність: Вибирайте регіони з хорошою мережевою інфраструктурою та високою доступністю дата-центрів.
В ідеалі, вибирайте локацію, яка географічно близька до ваших основних серверів, що генерують логи, щоб мінімізувати мережеві затримки та забезпечити швидку передачу даних.
Підготовка сервера
Перш ніж приступати до встановлення Loki та Promtail, необхідно виконати базове налаштування вашого свіжого VPS. Це підвищить безпеку та зручність роботи.
Передбачається, що ви використовуєте дистрибутив Ubuntu Server 22.04 LTS або 24.04 LTS, який є популярним вибором для VPS.
1. Підключення по SSH та оновлення системи
Підключіться до вашого сервера по SSH, використовуючи дані, надані провайдером. Зазвичай це root-користувач та пароль.
ssh root@ВАШ_IP_АДРЕС
Після успішного входу оновіть список пакетів та встановлені пакети до останніх версій:
sudo apt update && sudo apt upgrade -y
2. Створення нового користувача з правами sudo
Працювати під обліковим записом root небезпечно. Створимо нового користувача та надамо йому права sudo.
adduser lokiadmin
usermod -aG sudo lokiadmin
Тепер вийдіть з root-сесії та увійдіть як новий користувач:
exit
ssh lokiadmin@ВАШ_IP_АДРЕС
3. Налаштування автентифікації за SSH-ключами
Для підвищення безпеки рекомендується використовувати SSH-ключі замість паролів. Якщо у вас ще немає ключів, згенеруйте їх на локальній машині:
ssh-keygen -t rsa -b 4096
Скопіюйте публічний ключ на сервер (замініть lokiadmin та ВАШ_IP_АДРЕС):
ssh-copy-id lokiadmin@ВАШ_IP_АДРЕС
Тепер ви можете вимкнути автентифікацію за паролем для SSH. Відредагуйте файл /etc/ssh/sshd_config:
sudo nano /etc/ssh/sshd_config
Знайдіть та змініть наступні рядки:
#PasswordAuthentication yes
PasswordAuthentication no
#PermitRootLogin yes
PermitRootLogin no
Збережіть зміни (Ctrl+O, Enter) та вийдіть (Ctrl+X). Перезапустіть службу SSH:
sudo systemctl restart sshd
Після цього переконайтеся, що ви можете увійти за SSH-ключем, перш ніж закривати поточну сесію.
4. Налаштування файрволу (UFW)
UFW (Uncomplicated Firewall) — це зручна оболонка для iptables. Встановіть та налаштуйте його:
sudo apt install ufw -y
sudo ufw allow OpenSSH
sudo ufw allow http
sudo ufw allow https
sudo ufw enable
sudo ufw status
Перевірте статус. Мають бути дозволені порти 22 (SSH), 80 (HTTP) та 443 (HTTPS). Надалі ми додамо порт для Loki.
5. Встановлення Fail2Ban
Fail2Ban допомагає захиститися від атак перебору паролів, блокуючи IP-адреси, які роблять занадто багато невдалих спроб входу.
sudo apt install fail2ban -y
sudo systemctl enable fail2ban
sudo systemctl start fail2ban
Fail2Ban за замовчуванням захищає SSH. Ви можете налаштувати його, відредагувавши файл /etc/fail2ban/jail.local (створіть його, якщо немає) та додавши свої правила.
6. Встановлення базових утиліт
Встановіть кілька корисних утиліт, які знадобляться в процесі налаштування та налагодження:
sudo apt install curl wget git nano htop unzip -y
Тепер ваш сервер готовий до розгортання Grafana Loki та Promtail.
Встановлення ПЗ — покроково
Ми будемо встановлювати Loki та Promtail, завантажуючи бінарні файли з офіційних GitHub-репозиторіїв, та налаштовувати їх як служби Systemd. Nginx буде встановлено з репозиторію APT.
Актуальні версії ПЗ на 2026 рік будуть умовними, але ми будемо використовувати останні стабільні релізи, доступні на момент генерації.
Встановлення Grafana Loki
Створимо директорії для Loki та завантажимо актуальний бінарний файл.
# 1. Створюємо директорії для Loki
sudo mkdir -p /etc/loki
sudo mkdir -p /var/lib/loki
sudo chown -R lokiadmin:lokiadmin /var/lib/loki # Надаємо права на запис поточному користувачеві

# 2. Переходимо до тимчасової директорії
cd /tmp

# 3. Завантажуємо останню стабільну версію Loki (наприклад, v3.1.0 для 2026 року)
# Завжди перевіряйте актуальну версію на GitHub: https://github.com/grafana/loki/releases
LOKI_VERSION="3.1.0" # Вказуємо актуальну версію
wget "https://github.com/grafana/loki/releases/download/v${LOKI_VERSION}/loki-linux-amd64.zip"

# 4. Розпаковуємо архів
unzip "loki-linux-amd64.zip"

# 5. Переміщуємо бінарний файл до /usr/local/bin
sudo mv loki-linux-amd64 /usr/local/bin/loki

# 6. Переконуємося, що файл виконуваний
sudo chmod a+x /usr/local/bin/loki

# 7. Перевіряємо версію
loki --version
Тепер створимо користувача loki, під яким працюватиме служба, щоб забезпечити принцип найменших привілеїв.
# 1. Створюємо системного користувача loki без домашньої директорії та оболонки
sudo useradd --system --no-create-home --shell /bin/false loki

# 2. Передаємо володіння над директорією даних Loki користувачеві loki
sudo chown -R loki:loki /var/lib/loki
Встановлення Promtail
Аналогічно Loki, завантажуємо та встановлюємо Promtail.
# 1. Створюємо директорію для Promtail
sudo mkdir -p /etc/promtail

# 2. Переходимо до тимчасової директорії
cd /tmp

# 3. Завантажуємо останню стабільну версію Promtail (наприклад, v3.1.0 для 2026 року)
# Завжди перевіряйте актуальну версію на GitHub: https://github.com/grafana/loki/releases
PROMTAIL_VERSION="3.1.0" # Вказуємо актуальну версію
wget "https://github.com/grafana/loki/releases/download/v${PROMTAIL_VERSION}/promtail-linux-amd64.zip"

# 4. Розпаковуємо архів
unzip "promtail-linux-amd64.zip"

# 5. Переміщуємо бінарний файл до /usr/local/bin
sudo mv promtail-linux-amd64 /usr/local/bin/promtail

# 6. Переконуємося, що файл виконуваний
sudo chmod a+x /usr/local/bin/promtail

# 7. Перевіряємо версію
promtail --version
Створимо користувача promtail для запуску служби.
# 1. Створюємо системного користувача promtail без домашньої директорії та оболонки
sudo useradd --system --no-create-home --shell /bin/false promtail
Встановлення Nginx та Certbot
Nginx виступатиме як зворотний проксі та забезпечуватиме HTTPS доступ до Loki. Certbot допоможе автоматизувати випуск та оновлення TLS-сертифікатів від Let's Encrypt.
# 1. Встановлюємо Nginx з репозиторіїв Ubuntu
sudo apt install nginx -y

# 2. Запускаємо Nginx та додаємо його до автозавантаження
sudo systemctl start nginx
sudo systemctl enable nginx

# 3. Встановлюємо Certbot та плагін для Nginx
sudo apt install certbot python3-certbot-nginx -y
На цьому етапі основні компоненти встановлені. Тепер перейдемо до їх конфігурування.
Конфігурація
Правильна конфігурація — ключ до стабільної та ефективної роботи системи. Ми налаштуємо Loki, Promtail, Nginx та Certbot.
Конфігурація Loki
Створимо конфігураційний файл для Loki /etc/loki/config.yaml. Цей файл визначає, як Loki зберігатиме логи, які порти слухатиме та інші параметри.
sudo nano /etc/loki/config.yaml
Вставте наступний вміст:
auth_enabled: false # Для простоти вимикаємо автентифікацію. Для продакшену розгляньте basic_auth або OIDC

server:
  http_listen_port: 3100 # Порт, на якому Loki слухатиме HTTP-запити
  grpc_listen_port: 9095 # Порт для gRPC (використовується Promtail)

common:
  path_prefix: /var/lib/loki/wal # Шлях для Write-Ahead Log
  replication_factor: 1 # Кількість реплік для зберігання даних
  ring:
    instance_addr: 127.0.0.1
    kvstore:
      store: inmemory # Для простої установки використовуємо inmemory, для продакшену розгляньте Consul/Etcd
    replication_factor: 1

schema_config:
  configs:
    - from: 2020-10-24 # Дата початку використання цієї схеми
      store: boltdb-shipper # Використовуємо boltdb-shipper для зберігання індексів
      object_store: filesystem # Зберігання чанків логів на файловій системі
      schema: v12
      index:
        prefix: index_
        period: 24h

storage_config:
  boltdb_shipper:
    active_index_directory: /var/lib/loki/boltdb-shipper-active # Директорія для активних індексів
    cache_location: /var/lib/loki/boltdb-shipper-cache # Директорія для кешу індексів
    resync_interval: 5s
    shared_store: filesystem
  filesystem:
    directory: /var/lib/loki/chunks # Директорія для зберігання чанків логів

compactor:
  working_directory: /var/lib/loki/compactor # Директорія для компактора
  shared_store: filesystem

limits_config:
  enforce_metric_name: false
  reject_old_samples: true
  reject_old_samples_max_age: 168h # Відхиляти семпли старші 7 днів
  max_query_lookback: 720h # Максимальний період для запитів (30 днів)
  max_query_series: 5000 # Максимальна кількість серій у запиті
  max_query_length: 720h # Максимальна тривалість запиту
  max_global_streams_per_user: 5000000
  max_streams_per_user: 100000

ruler:
  storage:
    type: local
    local:
      directory: /var/lib/loki/rules
  rule_path: /var/lib/loki/rules-temp
  alertmanager_url: http://localhost:9093 # Приклад, якщо використовуватимете Alertmanager
  ring:
    kvstore:
      store: inmemory

# Налаштування для запитів (query-frontend, query-scheduler)
query_range:
  align_queries_with_step: true

# Налаштування для ingester (компонент, який приймає логи)
ingester:
  lifecycler:
    address: 127.0.0.1
    ring:
      kvstore:
        store: inmemory
      replication_factor: 1
    final_sleep: 0s
  chunk_idle_period: 5m
  max_transfer_retries: 0
Збережіть файл. Тепер створимо службу Systemd для Loki.
sudo nano /etc/systemd/system/loki.service
Вставте наступний вміст:
[Unit]
Description=Loki log aggregation system
After=network.target

[Service]
User=loki
Group=loki
Type=simple
ExecStart=/usr/local/bin/loki -config.file /etc/loki/config.yaml
Restart=on-failure
RestartSec=5s

[Install]
WantedBy=multi-user.target
Збережіть файл, перезавантажте Systemd та запустіть Loki:
sudo systemctl daemon-reload
sudo systemctl start loki
sudo systemctl enable loki
sudo ufw allow 3100/tcp # Відкриваємо порт Loki
sudo ufw reload
Перевірте статус Loki:
sudo systemctl status loki
Має бути active (running).
Конфігурація Promtail
Тепер налаштуємо Promtail для збору логів. Створимо файл /etc/promtail/config.yaml.
sudo nano /etc/promtail/config.yaml
Вставте наступний вміст. Цей приклад збиратиме логи системного журналу та логи Nginx.
server:
http_listen_port: 9080
grpc_listen_port: 0
positions:
filename: /var/lib/promtail/positions.yaml # Файл для відстеження позицій у логах
clients:
- url: http://localhost:3100/loki/api/v1/push # URL для надсилання логів до Loki
scrape_configs:
- job_name: system
static_configs:
- targets:
- localhost
labels:
job: varlogs
__path__: /var/log/*log # Збираємо всі .log файли з /var/log
host: YOUR_HOSTNAME # Замініть на реальне ім'я хоста вашого VPS
pipeline_stages:
- docker: {} # Приклад, якби Promtail був у Docker, тут можна використовувати інші парсери
- match:
selector: '{job="varlogs"}'
stages:
- regex:
expression: '^(?PВАЖЛИВО: Замініть YOUR_HOSTNAME на актуальне ім'я хоста вашого VPS. Також переконайтеся, що шляхи до логів (/var/log/*log, /var/log/nginx/access.log, /var/log/nginx/error.log) відповідають вашій системі.
Збережіть файл. Тепер створимо службу Systemd для Promtail.
sudo nano /etc/systemd/system/promtail.service
Вставте наступний вміст:
[Unit]
Description=Promtail log collector
After=network.target

[Service]
User=promtail
Group=promtail
Type=simple
ExecStart=/usr/local/bin/promtail -config.file /etc/promtail/config.yaml
Restart=on-failure
RestartSec=5s

[Install]
WantedBy=multi-user.target
Збережіть файл, перезавантажте Systemd та запустіть Promtail:
sudo systemctl daemon-reload
sudo systemctl start promtail
sudo systemctl enable promtail
Перевірте статус Promtail:
sudo systemctl status promtail
Має бути active (running).
Конфігурація Nginx
Nginx виступатиме як зворотний проксі для Loki. Спочатку видалимо конфігурацію Nginx за замовчуванням:
sudo rm /etc/nginx/sites-enabled/default
Створимо новий файл конфігурації для Loki, наприклад, /etc/nginx/sites-available/loki.conf.
sudo nano /etc/nginx/sites-available/loki.conf
Вставте наступний вміст. Замініть your.domain.com на ваш домен, який вказуватиме на ваш VPS.
server {
    listen 80;
    listen [::]:80;
    server_name your.domain.com; # Замініть на ваш домен

    location / {
        proxy_pass http://localhost:3100; # Проксіюємо запити на Loki
        proxy_set_header Host $host;
        proxy_set_header X-Real-IP $remote_addr;
        proxy_set_header X-Forwarded-For $proxy_add_x_forwarded_for;
        proxy_set_header X-Forwarded-Proto $scheme;
        proxy_read_timeout 300s; # Збільшуємо таймаут для великих запитів
    }
}
Збережіть файл. Тепер активуємо цей конфіг, створивши символічне посилання:
sudo ln -s /etc/nginx/sites-available/loki.conf /etc/nginx/sites-enabled/
Перевірте конфігурацію Nginx на помилки та перезапустіть його:
sudo nginx -t
sudo systemctl restart nginx
Якщо помилок немає, Nginx має успішно перезапуститися.
Налаштування HTTPS з Certbot
Для безпечного доступу до Loki через Nginx використовуємо Certbot для отримання TLS-сертифіката від Let's Encrypt.
sudo certbot --nginx -d your.domain.com
Certbot проведе вас через процес. Вам потрібно буде ввести адресу електронної пошти для сповіщень та погодитися з умовами обслуговування. Він автоматично виявить ваш Nginx-сервер-блок для your.domain.com та змінить його, додавши налаштування HTTPS та перенаправлення HTTP на HTTPS.
Після успішного налаштування Certbot, ваш файл /etc/nginx/sites-available/loki.conf виглядатиме приблизно так (Certbot додасть свої директиви):
server {
    listen 80;
    listen [::]:80;
    server_name your.domain.com;

    # Certbot додасть сюди перенаправлення на HTTPS
    return 301 https://$host$request_uri;
}

server {
    listen 443 ssl http2;
    listen [::]:443 ssl http2;
    server_name your.domain.com;

    ssl_certificate /etc/letsencrypt/live/your.domain.com/fullchain.pem; # Шлях до сертифіката
    ssl_certificate_key /etc/letsencrypt/live/your.domain.com/privkey.pem; # Шлях до приватного ключа
    include /etc/letsencrypt/options-ssl-nginx.conf;
    ssl_dhparam /etc/letsencrypt/ssl-dhparams.pem;

    location / {
        proxy_pass http://localhost:3100;
        proxy_set_header Host $host;
        proxy_set_header X-Real-IP $remote_addr;
        proxy_set_header X-Forwarded-For $proxy_add_x_forwarded_for;
        proxy_set_header X-Forwarded-Proto $scheme;
        proxy_read_timeout 300s;
    }
}
Certbot також налаштує автоматичне оновлення сертифікатів. Ви можете перевірити це:
sudo systemctl status certbot.timer
sudo certbot renew --dry-run
Перевірка працездатності
Переконаємося, що всі компоненти працюють коректно.
- Перевірка Loki:
curl -v http://localhost:3100/readyМає повернутися статус
200 OKта повідомленняLoki is ready. - Перевірка Promtail:
sudo journalctl -u promtail.service -fВи побачите логи Promtail. Переконайтеся, що немає помилок при надсиланні логів до Loki.
- Перевірка Nginx та HTTPS:
Відкрийте в браузері
https://your.domain.com. Ви повинні побачити інтерфейс Loki. Якщо ви бачите помилку404або502 Bad Gateway, перевірте логи Nginx (/var/log/nginx/error.log) та Loki. - Перевірка логів у Loki:
З командного рядка можна виконати запит до Loki через
curl, щоб переконатися, що логи надходять:curl -G "https://your.domain.com/loki/api/v1/query_range" --data-urlencode 'query={job="varlogs"}' | jq .Ви повинні побачити JSON-відповідь з вашими логами. Якщо
jqне встановлено, встановіть його:sudo apt install jq -y.Для зручнішого перегляду логів ви можете підключити Loki до Grafana. Встановіть Grafana на окремому сервері або як Docker-контейнер та додайте Loki як джерело даних. Тоді ви зможете використовувати мову запитів LogQL у Grafana Explore.
Резервні копії та обслуговування
Резервне копіювання та регулярне обслуговування є критично важливими для будь-якої системи, особливо для системи логування, де втрата даних може бути катастрофічною.
Що резервувати
Для Loki основні дані, які потрібно резервувати, це:
- Конфігураційні файли:
/etc/loki/config.yaml,/etc/promtail/config.yaml, конфігурація Nginx/etc/nginx/sites-available/loki.confта сертифікати Let's Encrypt/etc/letsencrypt/. - Дані Loki: Директорії, зазначені в
storage_config(/var/lib/loki/chunks,/var/lib/loki/boltdb-shipper-active,/var/lib/loki/boltdb-shipper-cache). Ці дані містять самі логи та їх індекси. - Позиції Promtail: Файл
/var/lib/promtail/positions.yaml. Він відстежує, до якого місця Promtail прочитав кожен файл логів. Якщо його втратити, Promtail може почати читати логи з самого початку після відновлення, що призведе до дублювання.
Простий скрипт авторезервування
Ми створимо простий скрипт, який архівуватиме ключові файли та директорії. Для зберігання резервних копій рекомендується використовувати зовнішнє сховище, а не той самий VPS.
sudo nano /usr/local/bin/backup_loki.sh
Вставте наступний вміст. Замініть /path/to/your/backup/destination на реальний шлях до вашої директорії для резервних копій (наприклад, змонтований S3-бакет або NFS-ресурс).
#!/bin/bash

# Директорія для тимчасових резервних копій
BACKUP_DIR="/tmp/loki_backup_$(date +%Y%m%d%H%M%S)"
mkdir -p "$BACKUP_DIR"

# Директорія для зберігання фінальних архівів
FINAL_BACKUP_DESTINATION="/path/to/your/backup/destination" # ЗАМІНІТЬ ЦЕЙ ШЛЯХ
mkdir -p "$FINAL_BACKUP_DESTINATION"

# Файли та директорії для резервного копіювання
CONFIG_FILES="/etc/loki/config.yaml /etc/promtail/config.yaml /etc/nginx/sites-available/loki.conf"
LETSENCRYPT_DIR="/etc/letsencrypt"
LOKI_DATA_DIR="/var/lib/loki"
PROMTAIL_POSITIONS="/var/lib/promtail/positions.yaml"

# Копіюємо конфігураційні файли та сертифікати
cp -r $CONFIG_FILES "$BACKUP_DIR/"
cp -r $LETSENCRYPT_DIR "$BACKUP_DIR/"
cp $PROMTAIL_POSITIONS "$BACKUP_DIR/"

# Зупиняємо Loki та Promtail для консистентного резервного копіювання даних
# У ПРОДАКШЕНІ розгляньте складніші методи для гарячого резервного копіювання або реплікації
sudo systemctl stop loki
sudo systemctl stop promtail

# Копіюємо дані Loki (це може зайняти багато часу для великих обсягів)
# Використовуємо rsync для інкрементального копіювання
sudo rsync -az "$LOKI_DATA_DIR" "$BACKUP_DIR/"

# Запускаємо Loki та Promtail назад
sudo systemctl start loki
sudo systemctl start promtail

# Створюємо архів
ARCHIVE_NAME="loki_backup_$(date +%Y%m%d%H%M%S).tar.gz"
tar -czf "$FINAL_BACKUP_DESTINATION/$ARCHIVE_NAME" -C "$BACKUP_DIR" .

# Видаляємо тимчасові файли
rm -rf "$BACKUP_DIR"

# Очищення старих резервних копій (наприклад, зберігаємо 7 днів)
find "$FINAL_BACKUP_DESTINATION" -name "loki_backup_.tar.gz" -type f -mtime +7 -delete

echo "Резервне копіювання Loki завершено: $FINAL_BACKUP_DESTINATION/$ARCHIVE_NAME"
Зробіть скрипт виконуваним:
sudo chmod +x /usr/local/bin/backup_loki.sh
Куди зберігати резервні копії
Ніколи не зберігайте резервні копії на тому ж сервері, що й оригінальні дані. Якщо сервер вийде з ладу, ви втратите і дані, і резервні копії.
- Зовнішнє S3-сумісне об'єктне сховище: Найбільш поширений і надійний варіант. Використовуйте такі сервіси, як AWS S3, DigitalOcean Spaces, Backblaze B2 або MinIO (для self-hosted). Для завантаження можна використовувати утиліти типу
s3cmdабоrclone. - Окремий VPS/Dedicated сервер: Виділіть окремий сервер спеціально для зберігання резервних копій. Можна використовувати
rsyncпо SSH для копіювання архівів. - NFS-сховище: Якщо у вас є централізоване мережеве сховище.
Для інтеграції з S3-подібним сховищем, ви можете встановити s3cmd або rclone та додати команду завантаження до вашого скрипта резервного копіювання.
# Приклад додавання до скрипта backup_loki.sh для S3 (після створення tar.gz)
# sudo apt install rclone -y
# rclone config # Налаштуйте rclone для вашого S3-провайдера
# rclone copy "$FINAL_BACKUP_DESTINATION/$ARCHIVE_NAME" "your_s3_remote:your-bucket-name/loki-backups/"
Автоматизація резервного копіювання за допомогою Cron
Додайте скрипт до розкладу Cron для щоденного виконання:
sudo crontab -e
Додайте наступний рядок для виконання скрипта щодня о 03:00 ночі:
0 3 /usr/local/bin/backup_loki.sh >> /var/log/loki_backup.log 2>&1
Оновлення: Rolling vs. Maintenance Window
- Rolling updates (для кластера): Якщо Loki розгорнуто в кластері (чого ми не робили в цьому посібнику, оскільки це VPS), ви можете оновлювати вузли по черзі, щоб підтримувати доступність системи.
- Maintenance window (для одиночного VPS): Для одиночного VPS, як у нашому випадку, оновлення Loki та Promtail потребуватимуть короткого "вікна обслуговування", під час якого служби будуть зупинені.
- Зупиніть Promtail та Loki.
- Завантажте нові бінарні файли.
- Замініть старі бінарники новими.
- Запустіть Loki, потім Promtail.
- Перевірте логи та працездатність.
Рекомендується проводити оновлення в неробочий час і завжди мати свіжу резервну копію.
Вирішення проблем + FAQ
У цьому розділі зібрано поширені проблеми та питання, які можуть виникнути при розгортанні та експлуатації Grafana Loki.
Loki або Promtail не запускаються, або неактивні. Що робити?
Якщо служба Loki або Promtail не запускається або її статус failed, перше, що потрібно перевірити, це логи Systemd. Використовуйте команди:
sudo systemctl status loki.service
sudo journalctl -u loki.service -f
Аналогічно для Promtail: sudo systemctl status promtail.service та sudo journalctl -u promtail.service -f. Логи часто містять інформацію про помилки конфігурації, проблеми з доступом до файлів або зайняті порти. Переконайтеся, що конфігураційні файли config.yaml синтаксично правильні (використовуйте онлайн-валідатор YAML) і що користувач loki/promtail має права на читання файлів конфігурації та запис у директорії даних.
Я не бачу логів у Loki UI (через Grafana або curl).
Якщо логи не надходять, перевірте наступне:
- Статус Promtail: Переконайтеся, що Promtail запущений і працює без помилок (
sudo systemctl status promtail). - Логи Promtail: Перевірте логи Promtail (
sudo journalctl -u promtail.service -f) на наявність помилок при відправленні логів до Loki. Часті помилки:connection refused(Loki не доступний),400 Bad Request(проблема з форматом логів або мітками). - Конфігурація Promtail: Переконайтеся, що в
/etc/promtail/config.yamlправильно вказаноurlLoki (http://localhost:3100/loki/api/v1/push) і що шляхи до файлів логів (__path__) вірні та доступні для читання користувачуpromtail. - Статус Loki: Переконайтеся, що Loki запущений і доступний на порту 3100.
- Файрвол: Перевірте, що порт 3100 відкритий, якщо Loki та Promtail знаходяться на різних серверах або Promtail намагається підключитися до Loki через публічний IP.
Nginx видає помилку 502 Bad Gateway або 404 Not Found.
Помилка 502 Bad Gateway зазвичай означає, що Nginx не може зв'язатися з бекендом (у даному випадку Loki). Перевірте:
- Статус Loki: Переконайтеся, що Loki запущений і слухає на
localhost:3100. - Логи Nginx: Перевірте
/var/log/nginx/error.log. Він точно вкаже причину помилки, наприклад,connection refused. - Конфігурація Nginx: Перевірте файл
/etc/nginx/sites-available/loki.conf. Переконайтеся, щоproxy_pass http://localhost:3100;вказано правильно.
Помилка 404 Not Found може вказувати на неправильну конфігурацію location / в Nginx або на те, що Loki не має такого шляху.
Який VPS-конфіг мінімально підійде для Grafana Loki?
Для невеликих проєктів, наприклад, для особистого блогу, невеликого SaaS-додатку або кількох мікросервісів, що генерують до 100 ГБ логів на місяць, мінімально підійде VPS з 2 ядрами CPU, 4 ГБ RAM та 100-200 ГБ NVMe SSD. Швидкість диска тут більш критична, ніж чистий обсяг, оскільки Loki активно працює з диском. Переконайтеся, що обраний тарифний план пропонує достатньо швидкий SSD для ефективної роботи з індексами та чанками логів.
Що вибрати — VPS чи dedicated для цього завдання?
Вибір між VPS та виділеним сервером залежить від масштабу вашого завдання. Для більшості індивідуальних розробників, малих команд та проєктів з обсягом логів до 1-2 ТБ на місяць, VPS буде оптимальним вибором з точки зору вартості та простоти управління. Loki спроєктований бути легковажним, що робить його ідеальним для VPS. Виділений сервер стає необхідним, коли потрібна максимальна продуктивність, гарантовані ресурси без оверселінгу, дуже великі обсяги логів (терабайти на день), або специфічні вимоги до апаратного забезпечення (наприклад, RAID-масиви для дисків, високопродуктивні мережеві карти). Якщо ви тільки починаєте, завжди обирайте VPS, а потім масштабуйтеся до dedicated, якщо виникне реальна необхідність.
Як забезпечити безпеку Loki?
У цьому посібнику ми відключили автентифікацію (auth_enabled: false) для спрощення, але для продакшену це неприйнятно. Рекомендується:
- Basic Auth через Nginx: Nginx може надавати базову HTTP-автентифікацію перед проксіюванням запитів до Loki.
- OIDC/OAuth2: Якщо ви використовуєте Grafana, вона підтримує інтеграцію з OIDC/OAuth2, що дозволяє централізувати автентифікацію.
- TLS/HTTPS: Переконайтеся, що весь трафік до Loki йде через HTTPS (що ми налаштували з Nginx та Certbot).
- Файрвол: Обмежте доступ до портів Loki лише для необхідних IP-адрес.
- Принцип найменших привілеїв: Loki та Promtail працюють під окремими системними користувачами з обмеженими правами.
Як підключити Grafana до Loki?
Після розгортання Loki, ви можете легко підключити його до Grafana. Для цього:
- Встановіть Grafana (якщо ще не зробили).
- У Grafana перейдіть до
Configuration -> Data Sources. - Натисніть
Add data sourceта виберітьLoki. - У полі
URLвкажіть адресу вашого Loki-сервера, наприклад,https://your.domain.com. - Якщо ви використовуєте автентифікацію (наприклад, Basic Auth через Nginx), вкажіть відповідні облікові дані.
- Натисніть
Save & Test.
Після цього ви зможете використовувати Loki як джерело даних у Grafana Explore для запитів логів за допомогою LogQL та створення дашбордів.
Висновки та наступні кроки
Вітаємо! Ви успішно розгорнули та налаштували потужну та економічну систему централізованого логування на вашому VPS, використовуючи Grafana Loki, Promtail та Nginx. Тепер у вас є повний контроль над вашими логами, можливість швидко шукати та аналізувати події, що значно спрощує налагодження та моніторинг ваших застосунків та сервера.
Наступні кроки для розвитку вашої системи:
- Інтеграція з Grafana: Підключіть ваш Loki-сервер до існуючої або нової інсталяції Grafana. Це дозволить вам використовувати потужні можливості візуалізації Grafana, створювати дашборди, сповіщення та проводити глибший аналіз логів за допомогою мови запитів LogQL.
- Моніторинг Loki: Налаштуйте моніторинг самого Loki за допомогою Prometheus та Grafana. Loki надає метрики у форматі Prometheus, які можна збирати та візуалізувати для відстеження його продуктивності та стану.
- Масштабування та висока доступність: Якщо ваш обсяг логів значно зросте, розгляньте масштабування Loki шляхом додавання додаткових інстансів, використання об'єктного сховища (S3-сумісного) замість файлової системи для чанків логів та розподіленого сховища для індексів (наприклад, Consul або Etcd).
- Розширення збору логів: Налаштуйте Promtail для збору логів з усіх ваших застосунків, включно з Docker-контейнерами (якщо використовуєте), а також з інших серверів, якщо вони у вас є.