

Installing and Configuring Uptime Kuma on a VPS: Availability Monitoring and Telegram Notifications
TL;DR
In this guide, we will walk through the process of deploying Uptime Kuma — a powerful open-source infrastructure monitoring tool — on a virtual private server (VPS). We will set up automatic availability checks for websites, services, and ports, ensure security via a reverse proxy with SSL encryption, and integrate an instant notification system in Telegram. By the end of the tutorial, you will have your own professional monitoring dashboard running in an isolated Docker container with automatic updates and backups.
- Tech Stack: Docker, Docker Compose, Nginx/Caddy, Ubuntu 26.04 LTS.
- Setup Time: 30–40 minutes.
- Result: 24/7 monitoring with per-second precision and zero license costs.
- Key Feature: Full control over data and an unlimited number of monitors.
- Security: Firewall (UFW) configuration and automatic Let's Encrypt SSL certificates.
1. What we are setting up and why: The philosophy of Self-Hosted monitoring
For any online project owner, whether it's a landing page, SaaS platform, game server, or cryptocurrency node, downtime means direct losses. Traditionally, the monitoring market is divided into two camps: expensive Enterprise solutions (DataDog, New Relic) and limited free tiers of cloud services (UptimeRobot, StatusCake).
Uptime Kuma is the "golden mean" that has revolutionized the self-hosted segment. It is an open-source solution with a modern interface that is not inferior in functionality to paid counterparts. By installing it on your own VPS, you get:
- Privacy: Data about your infrastructure is not shared with third parties.
- No limits: You can monitor 10, 50, or 500 services without paying extra for each new "monitor".
- Flexibility: The ability to check services within your local network or VPN that are inaccessible to external cloud scanners.
- Multifunctionality: Support for HTTP(s), Ping, TCP Port, DNS records, Docker containers, and even game servers.
In 2026, monitoring has become even more critical due to the increasing complexity of network routes and more frequent DDoS attacks. Having your own tool that instantly notifies you via Telegram about a database crash or an expiring SSL certificate is a hygiene standard for any system administrator or developer.
2. What VPS configuration is needed for this task
Uptime Kuma is written in Node.js and uses SQLite as its database. This makes it extremely undemanding of resources. However, it is worth considering that monitoring should be the "most stable link" in your infrastructure. If the monitoring server goes down along with the main project, you won't know about it.
| Resource | Minimum requirements | Recommended (for 100+ monitors) |
|---|---|---|
| CPU | 1 core (Shared) | 2 cores (Dedicated) |
| RAM | 1 GB | 2-4 GB |
| Disk (SSD/NVMe) | 10 GB | 20 GB+ (for long log history) |
| OS | Ubuntu 24.04 / 26.04 LTS | Ubuntu 26.04 LTS |
For stable operation of the monitoring system, a VPS with the specified characteristics is ideal. It is important to choose a server location different from the location of your main services. For example, if your site is hosted in Germany, it is better to place the monitoring server in the Netherlands or Finland. This will help eliminate false positives during local failures in a specific data center or with a regional backbone provider.
When should you choose a Dedicated server? If you plan to use Uptime Kuma as part of a massive monitoring system along with Prometheus, Grafana, and the ELK stack, which consume significant disk I/O (IOPS) resources. For Kuma alone, a virtual private server (VPS) is more than enough.
3. Server preparation: Basic security and system utilities
Before installing the application itself, it is necessary to prepare the "foundation" — the operating system. We will use Ubuntu 26.04 LTS, as it provides long-term support and fresh security packages.
First, let's update the package indices and the system itself:
sudo apt update && sudo apt upgrade -y
Let's install the basic set of utilities that we will need for work (curl, git, htop, ufw):
sudo apt install -y curl git wget htop software-properties-common apt-transport-https ca-certificates gnupg lsb-release
Firewall (UFW) Configuration: The security of the monitoring server is critical. We only need to open SSH (standard 22), HTTP (80), and HTTPS (443).
sudo ufw allow 22/tcp
sudo ufw allow 80/tcp
sudo ufw allow 443/tcp
sudo ufw enable
Note: If you are using a non-standard port for SSH, be sure to allow it before enabling UFW, otherwise you will lose access to the server.
It is also recommended to create a separate user with sudo privileges so as not to work under root:
adduser monitor-admin
usermod -aG sudo monitor-admin
# Переключаемся на нового пользователя
su - monitor-admin
4. Installing Docker and Docker Compose (current 2026 versions)
In 2026, using Docker is the de facto standard for deploying self-hosted applications. This isolates Uptime Kuma's dependencies (Node.js, libraries) from the main OS, simplifying updates and migration.
Add the official Docker GPG key:
sudo install -m 0755 -d /etc/apt/keyrings
curl -fsSL https://download.docker.com/linux/ubuntu/gpg | sudo gpg --dearmor -o /etc/apt/keyrings/docker.gpg
sudo chmod a+r /etc/apt/keyrings/docker.gpg
Connect the repository:
echo "deb [arch=$(dpkg --print-architecture) signed-by=/etc/apt/keyrings/docker.gpg] https://download.docker.com/linux/ubuntu \
$(. /etc/os-release && echo "$VERSION_CODENAME") stable" | sudo tee /etc/apt/sources.list.d/docker.list > /dev/null
Install Docker Engine and Docker Compose Plugin:
sudo apt update
sudo apt install -y docker-ce docker-ce-cli containerd.io docker-buildx-plugin docker-compose-plugin
Verify the installation is correct:
docker --version && docker compose version
Add our user to the docker group to run containers without sudo:
sudo usermod -aG docker $USER
# Чтобы изменения вступили в силу, перелогиньтесь или выполните:
newgrp docker
5. Deploying Uptime Kuma: A step-by-step guide
We will use the Docker Compose method, as it allows for easy configuration description in a YAML file and data volume management.
Create a working directory for the project:
mkdir -p ~/uptime-kuma && cd ~/uptime-kuma
Create the docker-compose.yml file:
nano docker-compose.yml
Insert the following content into the file:
services:
  uptime-kuma:
    image: louislam/uptime-kuma:1
    container_name: uptime-kuma
    restart: always
    volumes:
      - ./data:/app/data
      - /var/run/docker.sock:/var/run/docker.sock # Опционально: для мониторинга других контейнеров
    ports:
      - "127.0.0.1:3001:3001" # Привязываем к localhost для безопасности (будем использовать прокси)
    environment:
      - TZ=Europe/Moscow # Укажите ваш часовой пояс
Configuration Breakdown:
image: louislam/uptime-kuma:1— we use the stable version of the image.restart: always— the container will automatically start upon server boot or after a failure../data:/app/data— we mount a local folder to store the SQLite database. This ensures that your settings will not be lost when the container is updated.127.0.0.1:3001:3001— we map port 3001 only to the local interface. This is an important security step: the control panel will not be accessible from the outside directly via IP, only through a secure proxy server.
Start the service:
docker compose up -d
Check the container status:
docker ps
6. Configuring Access via Domain and SSL (HTTPS)
Accessing monitoring via an IP address through an unencrypted HTTP protocol is bad practice. Passwords can be intercepted, and the interface looks unprofessional. We will configure Caddy as a reverse proxy. Caddy automatically obtains and renews SSL certificates from Let's Encrypt.
Install Caddy on the server:
sudo apt install -y debian-keyring debian-archive-keyring apt-transport-https
curl -1G 'https://dl.cloudsmith.io/public/caddy/stable/gpg.key' | sudo gpg --dearmor -o /usr/share/keyrings/caddy-stable-archive-keyring.gpg
curl -1G 'https://dl.cloudsmith.io/public/caddy/stable/debian.deb.txt' | sudo tee /etc/apt/sources.list.d/caddy-stable.list
sudo apt update
sudo apt install caddy
Edit the Caddy configuration file (Caddyfile):
sudo nano /etc/caddy/Caddyfile
Replace the file contents with the following (substitute your domain):
status.yourdomain.com {
    reverse_proxy 127.0.0.1:3001

    log {
        output file /var/log/caddy/uptime_access.log
    }
}
Apply the settings:
sudo systemctl restart caddy
Now, provided you have pointed your domain's A-record to the server's IP, your Uptime Kuma panel is available at https://status.yourdomain.com with a valid SSL certificate.
7. Telegram Integration: Creating a Bot and Configuring Alerts
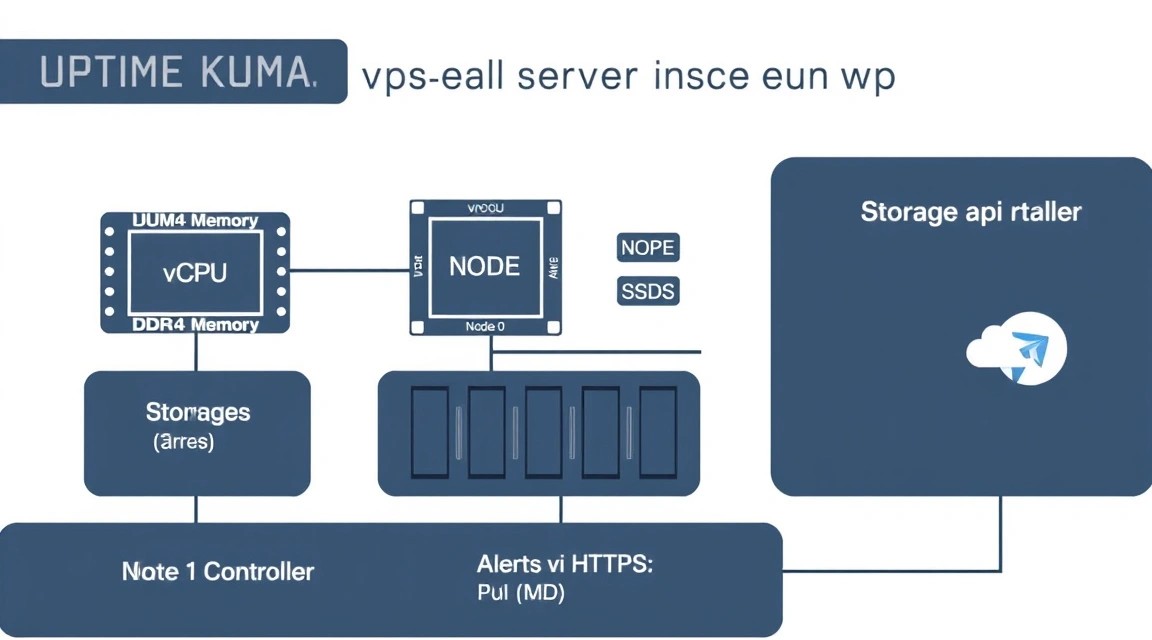
Monitoring is useless if you don't find out about a problem instantly. Telegram is the most reliable and fastest way to receive notifications.
Step 1: Creating a Bot via BotFather
- Find the @BotFather bot in Telegram.
- Send the
/newbotcommand. - Enter a name for the bot (e.g., "My Server Monitor") and a unique username (e.g.,
kuma_alert_123_bot). - Copy the received API Token.
Step 2: Obtaining the Chat ID
For the bot to know where to write, it needs a chat ID (your personal one or a group's):
- Send any message to the bot.
- Go to the link in your browser:
https://api.telegram.org/bot<YOUR_TOKEN>/getUpdates. - Find the
"chat":{"id":123456789}object in the JSON response. This is your Chat ID.
Step 3: Configuration in Uptime Kuma
- Go to the Uptime Kuma panel → Settings → Notifications.
- Click Setup Notification.
- Select type: Telegram.
- Enter the Token and Chat ID.
- Click Test. If a "Test System" message arrives in Telegram, click Save.
8. Advanced Monitor Configuration: HTTP, TCP, DNS, Steam
Uptime Kuma allows you to configure checks very flexibly. Let's look at the main types of monitors you will need.
HTTP(s) Monitoring
This is the primary type for websites. You can check not only availability (code 200) but also the presence of a specific word on the page. This is useful if the site returns 200 OK but actually displays a database error.
- URL: Your website address.
- Heartbeat Interval: 60 seconds (optimal).
- Retries: 3 (to avoid false alerts during short-term network lags).
- Upside Down Mode: Alert if the service BECOMES available (useful for debugging).
Port Monitoring (TCP)
Used to check services that do not have a web interface: SSH (22), databases (5432, 3306), game servers. Kuma simply tries to establish a TCP connection with the specified port.
Keyword Check
If your site is hacked and the content is replaced, a standard HTTP monitor might not notice the trick. Set up a check for the presence of your brand or a unique word in the footer. If the word disappears, Kuma will raise an alarm.
Push Monitoring (Heartbeat)
This is a "reverse" type of monitoring. Uptime Kuma gives you a unique link that your script (e.g., a backup script on the server) should "ping" after successfully completing a task. If Kuma does not receive a signal within an hour, it means the backup failed.
9. Backups, Maintenance, and System Updates
The monitoring server itself needs care. The most important file is kuma.db in the data folder.
Creating a Backup
The easiest way is to archive the data folder:
tar -cvzf kuma_backup_$(date +%F).tar.gz ~/uptime-kuma/data
Updating Uptime Kuma
Thanks to Docker, the update process takes less than a minute:
cd ~/uptime-kuma
docker compose pull
docker compose up -d
docker image prune -f # Removing old images to save space
Clearing History
Over time, the SQLite database can grow to gigabytes due to the history of checks. In the Uptime Kuma settings (Settings -> Primary), set Retention Day to 30-60 days. This will keep the database compact without losing important analytics.
10. Troubleshooting + FAQ: Solving Common Problems
Why does Uptime Kuma show "Down" even though the site opens?
Most often, this is due to the IP address of your monitoring server being blocked on the target site's side (e.g., via Cloudflare or local Fail2ban). Try running curl -I https://your-site.com directly from the monitoring VPS console. If you get a 403 or 429, add the monitoring IP to the Allowlist.
What is the minimum VPS configuration suitable?
To run 10-20 monitors, the cheapest plan with 1 GB of RAM and 1 CPU core is sufficient. The main resource consumption goes toward rendering graphs in the browser, not the checks themselves in the background. However, do not skimp on the disk—SQLite is sensitive to write speed.
What to choose—VPS or dedicated for this task?
For Uptime Kuma, VPS is the preferred option. The tool does not require direct work with hardware, and the flexibility of a virtual server allows for easy resource scaling or moving the instance between locations. A dedicated server would be overkill and unjustifiably expensive for this task.
How to monitor Docker containers on the same server?
In our docker-compose.yml, we mapped /var/run/docker.sock. Now, in the Kuma interface, you can add a "Docker Container" type monitor and simply select the container name from the dropdown list. Kuma will monitor its status (Running/Exited).
I forgot the admin password, what should I do?
You can reset the password via the console:
docker exec -it uptime-kuma npm run reset-password
11. Conclusions and Next Steps
We have successfully deployed a professional monitoring system on our own VPS. Now you are not dependent on the limitations of free plans from third-party services and have full control over your data. Your system is protected by SSL encryption, runs in an isolated container, and instantly notifies you of problems via Telegram.
What to do next?
- Public Status Page: Create a beautiful public page with a list of your services in the "Status Pages" menu. It can be linked to a separate domain (e.g.,
status.mycompany.com) and shown to clients. - SSL Monitoring: Set up notifications 7-14 days before certificates expire to avoid sudden HTTPS outages.
- Export to Prometheus: If your infrastructure grows, you can integrate Kuma with Grafana to build even more complex analytical reports.
Remember that monitoring is not a one-time setup, but a process. Regularly check the relevance of alerts and don't forget to update the system to protect the server from new vulnerabilities.