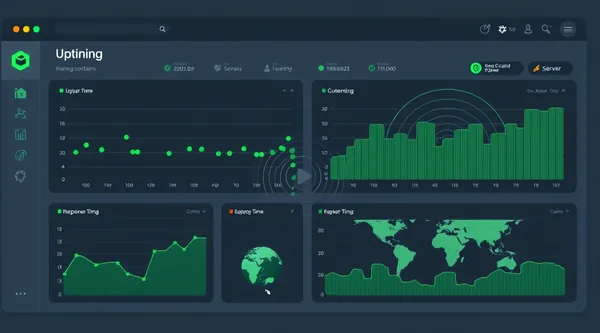
Grafana is an open-source visualization and alerting platform that turns metrics, logs and traces into dashboards. Running it self-hosted on a VPS means you pay a flat monthly server cost and keep 100% of your monitoring data, instead of Datadog, Grafana Cloud or New Relic charging you per host, per metric or per ingested gigabyte — bills that grow every time you add a server. The trade-off: you manage updates and backups yourself, and because Grafana is only the visualization layer, you also need a data source behind it (most commonly your own Prometheus).
⚡ Skip the setup: Valebyte deploys Grafana on a VPS in one click from $5/mo — managed, HTTPS, ready admin login.
What Grafana actually is (and what it is not)
This is the single most important thing to understand before you deploy it: Grafana does not collect or store metrics itself. It is the dashboard, query and alerting layer that sits on top of a data source. You point Grafana at where your data already lives — a time-series database, a log store, a SQL database or a cloud provider — and it queries and visualizes that data in real time.
So if you want a full monitoring stack, Grafana is one half of it. The other half is a data source that actually collects and stores the numbers. The most common pairing is Grafana + Prometheus: Prometheus scrapes and stores your metrics, Grafana draws the dashboards and fires the alerts. Other popular sources include Loki (logs), InfluxDB or TimescaleDB (time-series), Elasticsearch, and direct connections to PostgreSQL, MySQL or cloud APIs like CloudWatch.
If you only need dashboards over data you already have — say a PostgreSQL database or an existing Prometheus — Grafana alone is enough. If you are monitoring servers from scratch, plan to run Prometheus (or a similar collector) alongside it.
Why self-host instead of Datadog?
The cost story
SaaS monitoring is priced by usage, and that is where bills explode. Datadog charges per host per month, plus separate line items for custom metrics, log ingestion, APM, synthetics and more. Add ten servers with a few hundred custom metrics each and the monthly invoice can climb into the hundreds or thousands of dollars — and it keeps climbing as you scale. Grafana Cloud follows the same usage-based logic on active series and log volume.
Self-hosted Grafana on a VPS is a flat cost. A small VPS runs it comfortably, and the price does not change whether you dashboard 5 servers or 50. Your only scaling cost is the VPS resources you actually consume.
Data ownership
With self-hosting, every dashboard, metric and log stays on your server. Nothing is shipped to a third party, which matters for compliance, privacy and simply not being locked into a vendor's retention pricing. You decide how long to keep data and where it lives.
Comparison: Self-hosted Grafana vs Datadog vs Grafana Cloud
| Self-hosted Grafana | Datadog | Grafana Cloud | |
|---|---|---|---|
| Pricing model | Flat VPS cost | Per host + per metric/log usage | Usage-based (active series, log GB) |
| Data ownership | Full — stays on your VPS | Stored on Datadog | Stored on Grafana's cloud |
| Scaling cost | Only VPS resources | Grows per host/metric | Grows per series/volume |
| Data sources | 150+ (bring your own) | Turnkey built-in agents | 150+ (managed backends) |
| Best for | Cost control, data ownership | Turnkey APM at any budget | Grafana without ops work |
Comparison checked July 2026.

What you get with Grafana
- 150+ data sources: Prometheus, Loki, InfluxDB, Graphite, Elasticsearch, PostgreSQL, MySQL, CloudWatch, Azure Monitor, Google Cloud Monitoring and many more — mix them in a single dashboard.
- Dashboards: flexible panels, variables and templating, plus thousands of ready-made community dashboards you can import in seconds.
- Unified alerting: define alert rules across data sources and route notifications to Slack, email, PagerDuty, Telegram, webhooks and more.
- Explore: an ad-hoc query view for digging into metrics and logs without building a dashboard first — ideal for incident debugging.
The honest cons
- You manage it. Updates, backups and security patching are on you. On Valebyte the base install and HTTPS are handled, but ongoing upkeep is your responsibility.
- You still need a data source. Grafana alone won't monitor a server — budget for running Prometheus or another collector too.
- Datadog is more turnkey. Out of the box, Datadog and New Relic ship polished APM, auto-instrumentation and hundreds of one-click integrations. With Grafana you assemble the stack yourself.
Getting started on a VPS
You can install Grafana manually via Docker or the official repositories, connect it to your data source, and put it behind HTTPS. Or you skip that and deploy it pre-configured. On Valebyte, Grafana comes up on a VPS with a ready admin login and HTTPS already set, so you go straight to adding a data source and building dashboards — on flat, predictable pricing with full ownership of your data.
⚡ Skip the setup: Valebyte deploys Grafana on a VPS in one click from $5/mo — managed, HTTPS, ready admin login.