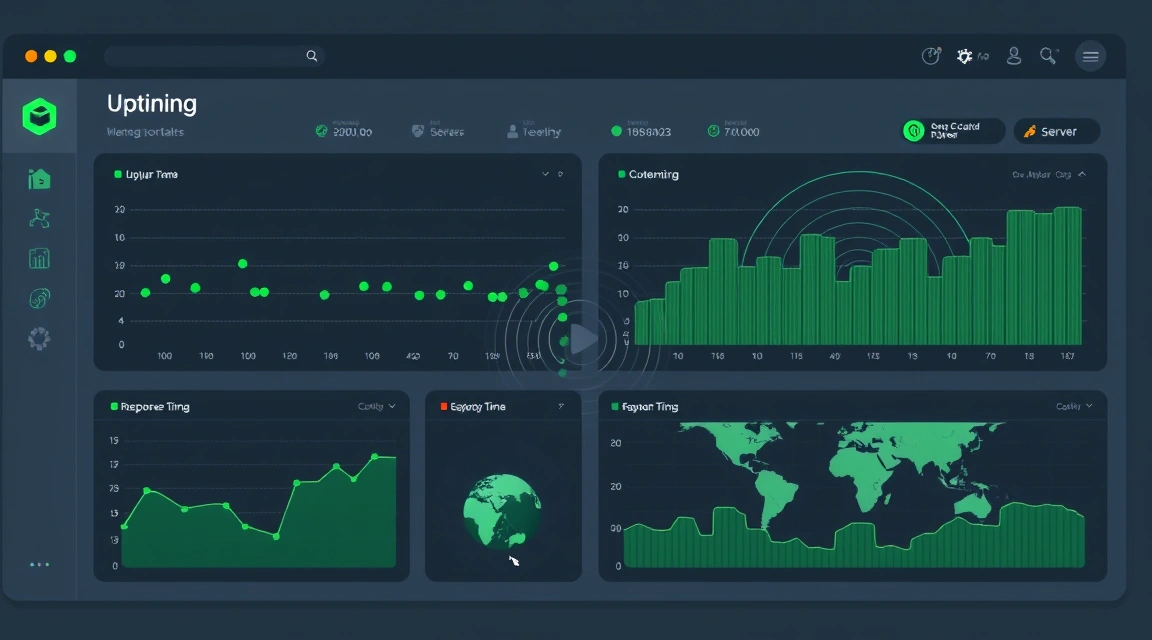

Uptime monitoring is the rare category where self-hosting won outright: Uptime Kuma gives you HTTP(S), TCP, ping, DNS and keyword checks, certificate-expiry warnings, 90+ notification integrations and public status pages from a single container idling around 256 MB. The per-monitor pricing of SaaS uptime tools stops making sense the day you have more than a handful of services. What is left to engineer is placement, scale limits and what to run next to it — that is this guide.
Rule zero: monitor from outside
A monitor that lives inside the infrastructure it watches has a blind spot the size of that infrastructure. If Kuma runs on the same server as your app, a dead server means no alert — the exact scenario you bought monitoring for. Placement logic:
- Different machine, different datacenter, ideally different provider than the things it checks. A $5–9 VPS in another city is the entire cost.
- Who watches the watcher: the cheapest honest answer is a second Kuma instance on another box, each monitoring the other's URL. Two tiny servers, mutual coverage, still cheaper than one SaaS plan.
- Latency realism: check from where your users are. A Frankfurt monitor says nothing about your US users' experience — our multi-city stock exists for exactly this kind of scatter.
What Kuma does well — and its real ceiling
Setup is genuinely one command (docker run), and the day-one feature set covers what 90% of teams need: interval checks down to 20 seconds, retries before alerting, maintenance windows, TLS expiry warnings, status pages you can put on a custom domain. Notifications reach everything from Telegram and Slack to plain SMTP and webhooks.
The ceiling is architectural: SQLite plus a single Node process. In practice the UI and history queries get sluggish past roughly 100–150 monitors at short intervals, and there is no clustering. Honest responses when you hit it:
- Split by concern: one instance for production, one for internal/lab — you were told to run two anyway.
- Stretch intervals: most services do not need 20-second checks; 60s halves the load at no practical cost.
- Outgrow it deliberately: Gatus (config-as-code, Postgres backend) for hundreds of checks in CI-managed YAML, or full Prometheus + Alertmanager when monitoring becomes a team's job, not a container's.
Uptime is half the picture: add node metrics
Kuma answers "is it up and how fast does it respond" — it cannot answer "why did it break". Pair it with a metrics layer on the machines themselves:
- Netdata — one-command install, per-second granularity, brilliant for the "what happened at 03:14" retro. Heavier default footprint; trim retention on small boxes.
- Prometheus node_exporter + Grafana — the industry-standard route when you already speak PromQL or plan to. More assembly, infinitely composable.
The combination — external Kuma for symptoms, on-box metrics for causes — is what actually shortens incidents. Disk-full and cert-expiry, the two most preventable outage causes in small fleets, are both covered: Kuma warns on certs, node metrics warn on disk.

Sizing and placement shortlist
| Setup | Hardware | Notes |
|---|---|---|
| Up to ~50 monitors | 1 vCPU / 1 GB VPS | Kuma + OS fit with room |
| 50–150 monitors + status pages | 2 vCPU / 2–4 GB | watch SQLite latency, stretch intervals |
| Hundreds of checks, team alerting | 4 GB+, consider Gatus/Prometheus | config-as-code pays off here |
Put the monitor in a different failure domain than the monitored: different provider or at minimum a different city from the same catalog. Checked July 8, 2026; Kuma's 2.x line keeps the same architecture, so the SQLite guidance stands.