Setting up Prometheus Monitoring on a Fedora Server
Prometheus is a monitoring and alerting system that allows you to track various server and application metrics. In this article, we'll look at how to set up Prometheus monitoring on a server running the Fedora operating system.
Before you begin installing and configuring Prometheus, make sure your server is running Fedora. If not, install it using the following command:
sudo dnf install fedora-release
After successfully installing the Fedora operating system, let's proceed with installing and configuring Prometheus. Use the following commands to install Prometheus:
sudo dnf install Prometheus
After installing Prometheus, you need to configure it to monitor the server. Create a Prometheus configuration file using the following command:
sudo nano /etc/prometheus/prometheus.yml
Open the created configuration file using a text editor and add the following code to monitor the server:
global:
  scrape_interval: 15s
  evaluation_interval: 15s

scrape_configs:
  - job_name: 'node'
    static_configs:
      - targets: ['localhost:9100']
After configuring Prometheus, save and close the file. Restart the Prometheus service using the following command:
sudo systemctl restart Prometheus
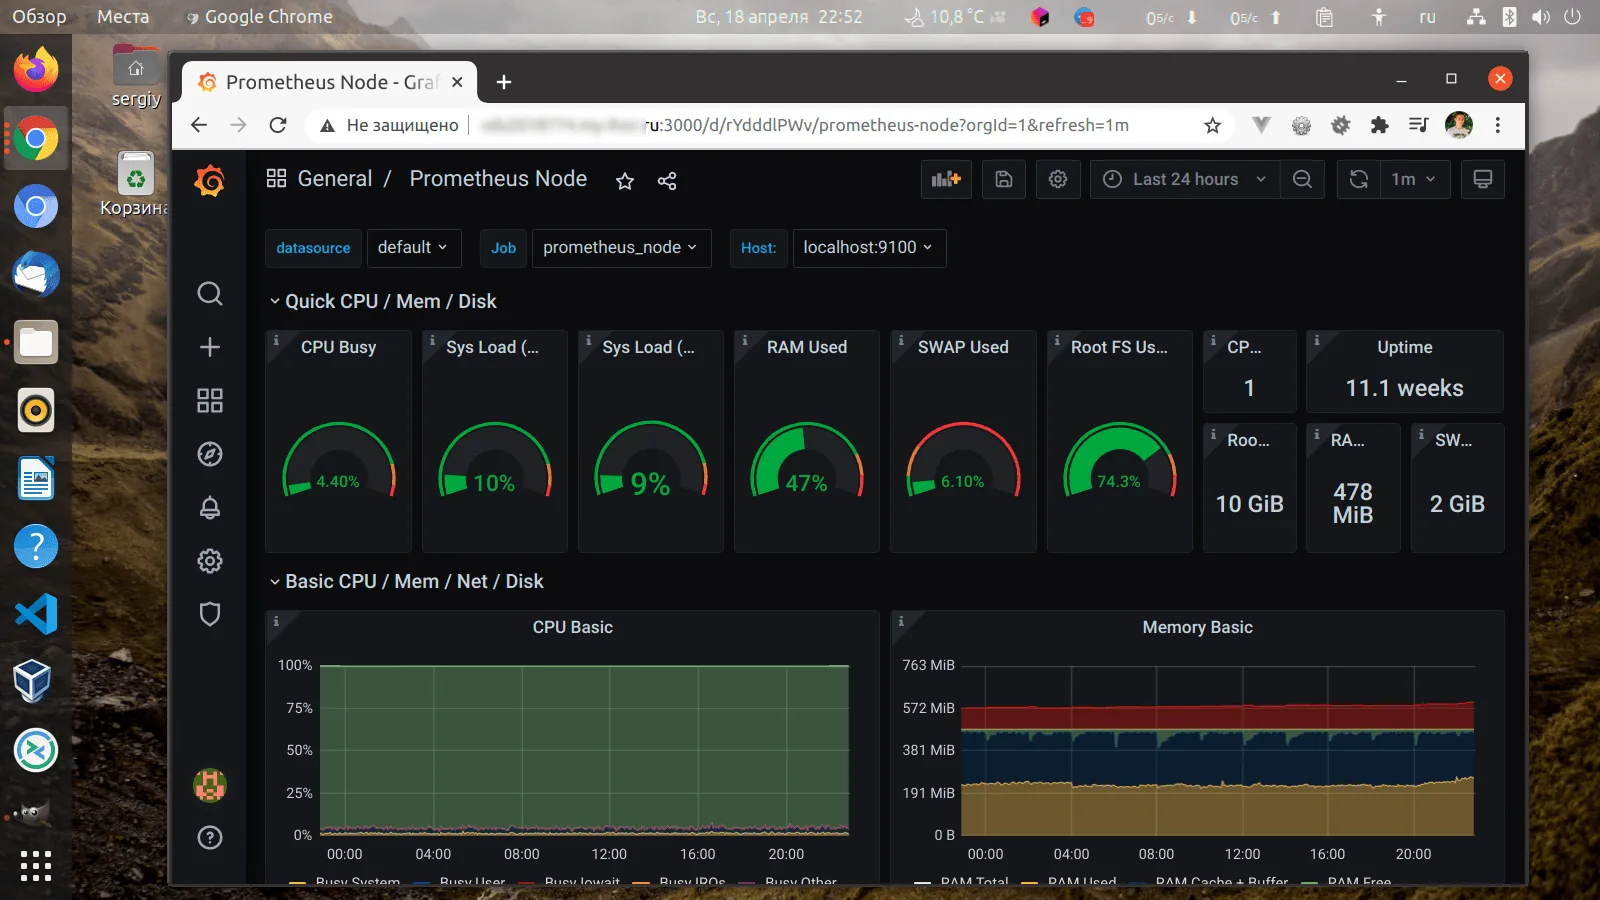
Prometheus is now configured to monitor your Fedora server. You can open the Prometheus web interface by entering the following address in your browser: http://localhost:9090. Here you will find various graphs and metrics of your server.
Remember to configure alerts in Prometheus to stay informed about all changes and issues on your server. Happy monitoring!