How to check server hardware temperature?
How to check server hardware temperature? Comprehensively, using software tools for continuous monitoring and periodic physical inspections. For us, fellow sysadmins, this is not just an item on a checklist, but a cornerstone of stable and long-lasting server infrastructure operation. Overheating is a silent killer of hardware, capable of leading to performance degradation, sudden failures, and, in the worst case, complete breakdown of expensive equipment. In this article, we will thoroughly examine what tools and methods are available for controlling the temperature regime, from software to physical inspection and preventive maintenance.
Why temperature monitoring is not a whim, but a necessity?

Before diving into technical details, let's remember why we so closely monitor the Celsius degrees in our server racks. High temperature is not just discomfort for the equipment; it is a direct threat to its performance and lifespan.
- Performance Degradation (Thermal Throttling): Upon reaching certain temperature thresholds, the processor or other components begin to reduce their clock speeds to prevent overheating. This directly leads to a slowdown in server operation, which is critical for high-load applications and services.
- Instability and Failures: Overheating can cause errors in memory, disks, and chipsets, leading to freezes, "blue screens of death" (BSOD), or sudden reboots. Imagine such a situation in the middle of a peak load!
- Reduced Component Lifespan: Continuous operation at elevated temperatures accelerates the degradation of semiconductors and other electronic elements, significantly shortening the overall lifespan of the equipment. What could have lasted 5-7 years might fail in 2-3 years.
- Risk of Complete Failure and Fire: In extreme cases, uncontrolled overheating can lead to the failure of entire modules or even a fire. Although the latter is rare, the risk exists, and it is unacceptable in data centers.
- Increased TCO (Total Cost of Ownership): Unplanned downtime, the need for emergency equipment replacement, data loss – all these result in significant financial and reputational losses. Preventing these problems through proper monitoring and maintenance is an investment.
Therefore, maintaining an optimal temperature regime is a key aspect of ensuring the reliability and efficiency of our infrastructure.
Temperature Control Methods: From Software to Physical Inspection
There are several approaches to checking server equipment temperature, each with its advantages and areas of application.
1. Software Monitoring: An Inside Look
Most modern servers are equipped with an arsenal of built-in sensors that provide detailed information about the temperature of various components. Access to this data is done programmatically.
Built-in Temperature Sensors and IPMI/BMC
Enterprise-class servers are almost always equipped with IPMI (Intelligent Platform Management Interface) or BMC (Baseboard Management Controller) controllers. This is essentially a separate microcomputer within the server that operates independently of the main OS and allows remote server management, even if it is turned off or the OS is not loaded. IPMI provides access to data from numerous sensors, including the temperature of processors, memory, chipsets, disks, VRM (Voltage Regulator Module), and other critical areas.
Advantages of IPMI:
- Out-of-band management: Monitoring and management without dependence on the operating system.
- Event logging: Recording temperature thresholds, fan errors, and other critical events.
- Notifications: Ability to set up automatic alerts via SNMP, email when thresholds are exceeded.
For working with IPMI in Linux, the ipmitool utility is often used. Example of getting sensor data:
# apt install ipmitool (or yum install OpenIPMI ipmitool)
# ipmitool sensor
This command will display a list of all available sensors and their current values, including temperature, voltage, fan speeds, etc.
# Example ipmitool sensor output:
CPU1 Temp        | 45.000     | C       | ok    | 0.000     | 0.000     | 0.000     | 80.000    | 85.000    | 90.000
CPU2 Temp        | 43.000     | C       | ok    | 0.000     | 0.000     | 0.000     | 80.000    | 85.000    | 90.000
FAN1             | 1500.000   | RPM     | ok    | 0.000     | 0.000     | 0.000     | 1000.000  | 8000.000  | 9000.000
...
Operating System and Utilities
Within the operating system, tools for temperature monitoring are also available:
- Linux:
lm_sensors: The primary tool for reading data from hardware sensors accessible through the Linux kernel. After installing thelm_sensorspackage and runningsensors-detectto identify chipsets, thesensorscommand will display the current temperatures of the CPU, motherboard, VRM, and other components.
# apt install lm-sensors
# sensors-detect  (answer 'yes' to most questions)
# sensors
Example
sensorsoutput:# coretemp-isa-0000 # Adapter: ISA adapter # Package id 0: +48.0°C (high = +80.0°C, crit = +100.0°C) # Core 0: +47.0°C (high = +80.0°C, crit = +100.0°C) # Core 1: +48.0°C (high = +80.0°C, crit = +100.0°C) # # nct6775-isa-0290 # Adapter: ISA adapter # CPU Fan: 1200 RPM (min = 100 RPM) # System Fan: 1500 RPM (min = 100 RPM) # intrusion0: OK # temp1: +35.0°C (high = +60.0°C, hyst = +55.0°C) # temp2: +40.0°C (high = +60.0°C, hyst = +55.0°C) hddtemporsmartctl: For monitoring the temperature of hard drives and SSDs.smartctl(from thesmartmontoolspackage) also provides access to S.M.A.R.T. data, which is extremely useful for assessing drive health.
# smartctl -a /dev/sda | grep Temperature_Celsius
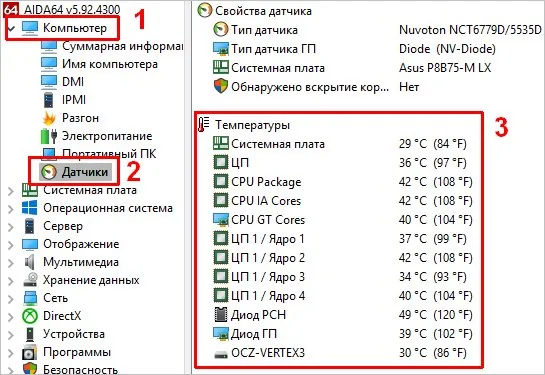
- Open Hardware Monitor, HWMonitor, SpeedFan: Popular utilities that provide a graphical interface for monitoring various sensors in the system. They are convenient for quick viewing, but for server use, console-based or centralized solutions are preferable.
Centralized Monitoring Systems
For serious infrastructures, manually running commands is not an option. This is where centralized monitoring systems like Zabbix, Prometheus + Grafana, Nagios, PRTG, and others come to the rescue. They allow:
- Automatic data collection: Via agents, SNMP, IPMI interfaces, or special plugins.
- Aggregation and visualization: All data is collected in a single interface, graphs and trends are built.
- Threshold and alert configuration: Ability to set thresholds for each sensor and receive notifications via email, SMS, Telegram, Slack, etc., when they are exceeded.
- Historical data: Analysis of temperature regimes over long periods to identify problematic trends.
For example, in Zabbix, you can configure items to read data from lm_sensors or directly through the server's IPMI interface, and then create triggers that will activate if the CPU temperature exceeds 75°C.
2. Physical Control: When Software Isn't Omnipotent
Software methods don't always provide a complete picture. Sometimes it's necessary to "feel" the situation firsthand, especially during diagnostics or after making configuration changes.
Thermal Indicators and Thermal Imagers
- Thermal indicators (thermal stickers): These are simple, inexpensive stickers that change color when a certain temperature is reached. They can be placed on components without built-in sensors (e.g., on VRMs of older motherboards, on chipsets, on individual capacitors). They provide only binary information ("was hot/not"), but can be useful for identifying local hot spots.
- Thermal imagers: A more professional tool. A thermal camera allows you to get a visual map of temperature distribution across the equipment surface. This is invaluable for:
- Identifying blocked airflow.
- Diagnosing faulty components that are heating up more than normal.
- Assessing the overall efficiency of the cooling system.
- Checking for uniform heating within the rack.
Using a thermal imager requires physical presence and is more of an audit or deep diagnostic tool than for everyday monitoring.
Visual Inspection and Airflow Audit
A mundane but very effective measure. Regular visual inspection can reveal many problems:
- Dust and dirt: The main enemy of any hardware. Accumulations of dust on heatsinks and fans drastically reduce cooling efficiency. Check ventilation grilles and the inside of the server.
- Fan condition: Are all fans spinning? Are there any unusual noises? Is the airflow direction correct? (In server racks, it's usually standardized: cold air from the front, hot air from the back).
- Cable management: A mess of cables inside the server or in the rack can create serious obstacles to air circulation. Neat cable routing is not only aesthetic but also functional.
- Blanking Panels in the Rack: Empty spaces in the rack between servers must be closed with blanking panels. This prevents hot air recirculation from the back of the rack to the front, ensuring cold air passes through the equipment, not around it.
- Hot/Cold Aisle Containment: This is standard in large data centers. Make sure your server is in the correct aisle and is not receiving hot air from neighboring racks.
3. Regular Maintenance: Prevention is Better Than Cure
The best monitoring is useless if preventive maintenance is not carried out.
Need a Reliable Server for Optimal Temperature?
Ensure stable operation for your equipment. Our dedicated servers provide ideal conditions for maintaining optimal temperatures. — from €5.99/mo.
Choose a Server →- Dust cleaning: Regular (every 3-6 months, depending on conditions) cleaning of internal server components with compressed air or a specialized vacuum cleaner. Special attention should be paid to CPU, GPU (if present), and power supply unit heatsinks.
- Thermal paste/thermal pad replacement: Thermal paste on the CPU and GPU dries out over time and loses its heat-conducting properties. It is recommended to change it every 2-3 years or when temperatures significantly increase. Thermal pads on chipsets and VRMs may also require replacement. Choose high-quality thermal interfaces designed for long-term operation.
- Fan inspection: Fans are consumables. Check them for bearing wear (unusual noise, vibration) and performance degradation. If in doubt, it's better to replace them.
- Firmware updates: Equipment manufacturers regularly release updates for BIOS/UEFI, IPMI/BMC firmware, RAID controllers, and other components. These updates often contain improvements in cooling management algorithms, which can positively affect the temperature regime.
- Log analysis: Periodically review OS system logs, as well as IPMI/BMC logs, for temperature warnings or fan failures.
Defining Thresholds and Responding
So, we know how to get temperature data. But what is considered normal, and what is an alarming signal?
- Normal temperatures: These vary greatly depending on the component, its load, and the manufacturer.
- CPU: 30-45°C at idle, 60-75°C under load. Maximum allowable temperatures (TjMax) are usually 90-105°C, but it's best not to aim for them.
- HDD: Optimally 30-45°C. Above 50°C is already a cause for concern, as it significantly shortens lifespan.
- SSD: Usually up to 60-70°C. Many NVMe SSDs can operate at even higher temperatures (up to 80°C), but it's better to keep them closer to 50-60°C.
- Chipsets, VRM: Can be hotter, up to 80-90°C under load, but stable operation at such values depends on the specific model and cooling efficiency.
- Warning and Critical Thresholds: Always set two thresholds:
- Warning: For example, 70°C for CPU. This is a signal to pay attention, check the load, and ventilation.
- Critical: For example, 80°C for CPU. This means immediate action is required, possibly reducing the load, or even temporarily shutting down the server if the temperature continues to rise.
Actions when thresholds are exceeded:
- Check the load: Perhaps an abnormally high load is the cause.
- Visual inspection: Dust, non-working fans, blocked airflow.
- Improve ventilation: Check blanking panels, cable management, room temperature.
- Reduce load: If the problem is not quickly resolved, temporarily migrate services or reduce the load.
- Component diagnostics: If the temperature is consistently high for one component, it may be faulty or its cooling system is inadequate.
Conclusion
Monitoring server equipment temperature is not a one-time event, but a continuous process requiring a systematic approach. It includes constant software control using built-in sensors and centralized monitoring systems, periodic physical inspections to identify non-obvious problems, and, of course, regular preventive maintenance.
The investment of time and resources in maintaining an optimal temperature regime will pay off handsomely: it will ensure stable operation of your infrastructure, extend the lifespan of expensive equipment, and minimize the risks of unplanned downtime. Remember that every degree Celsius matters, and caring for the "health" of your servers is the key to the success of your entire business. So, colleagues, let's keep our finger on the pulse... or rather, on the thermal sensors!
Seeking Maximum Performance and Reliability?
Our NVMe dedicated servers deliver superior speed and stability, minimizing overheating risks. Invest in the future of your business.
Order NVMe Server →