
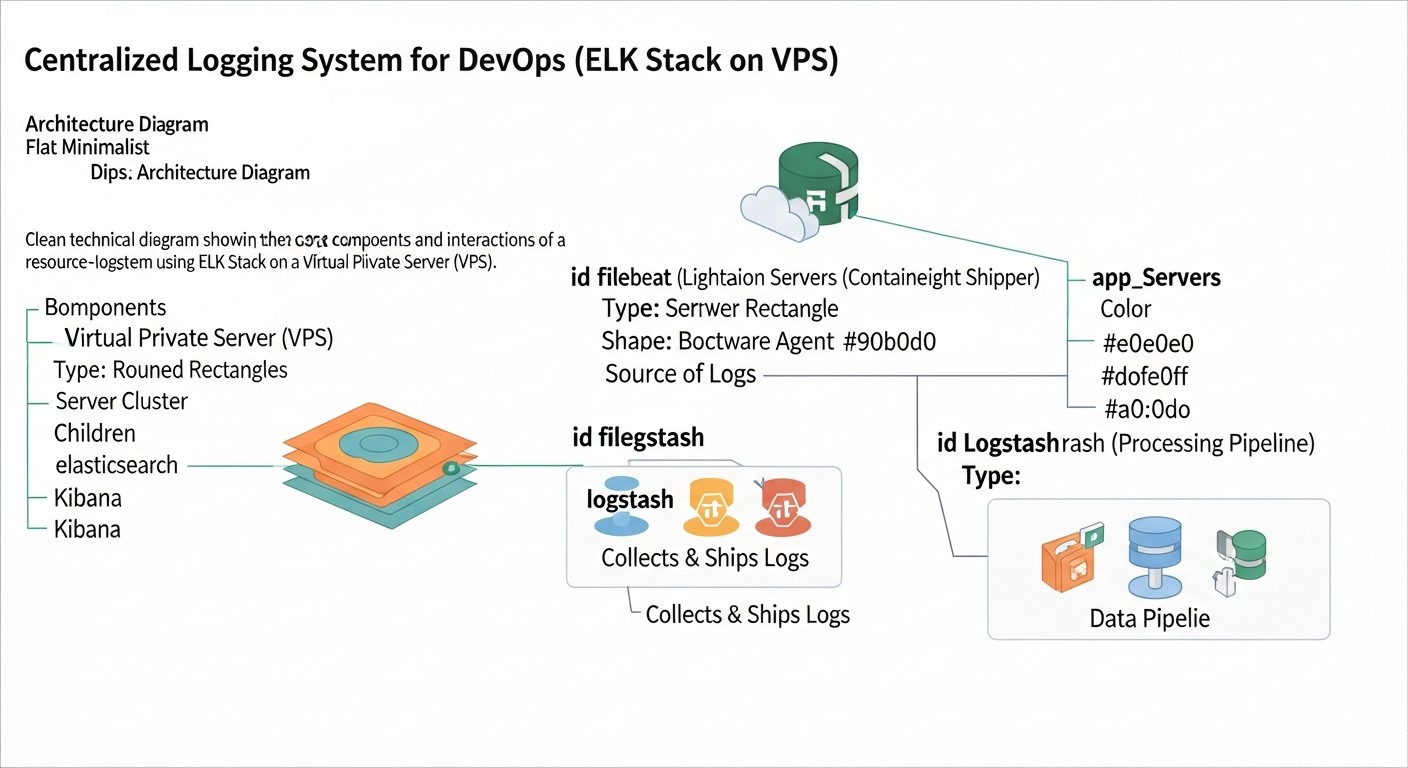
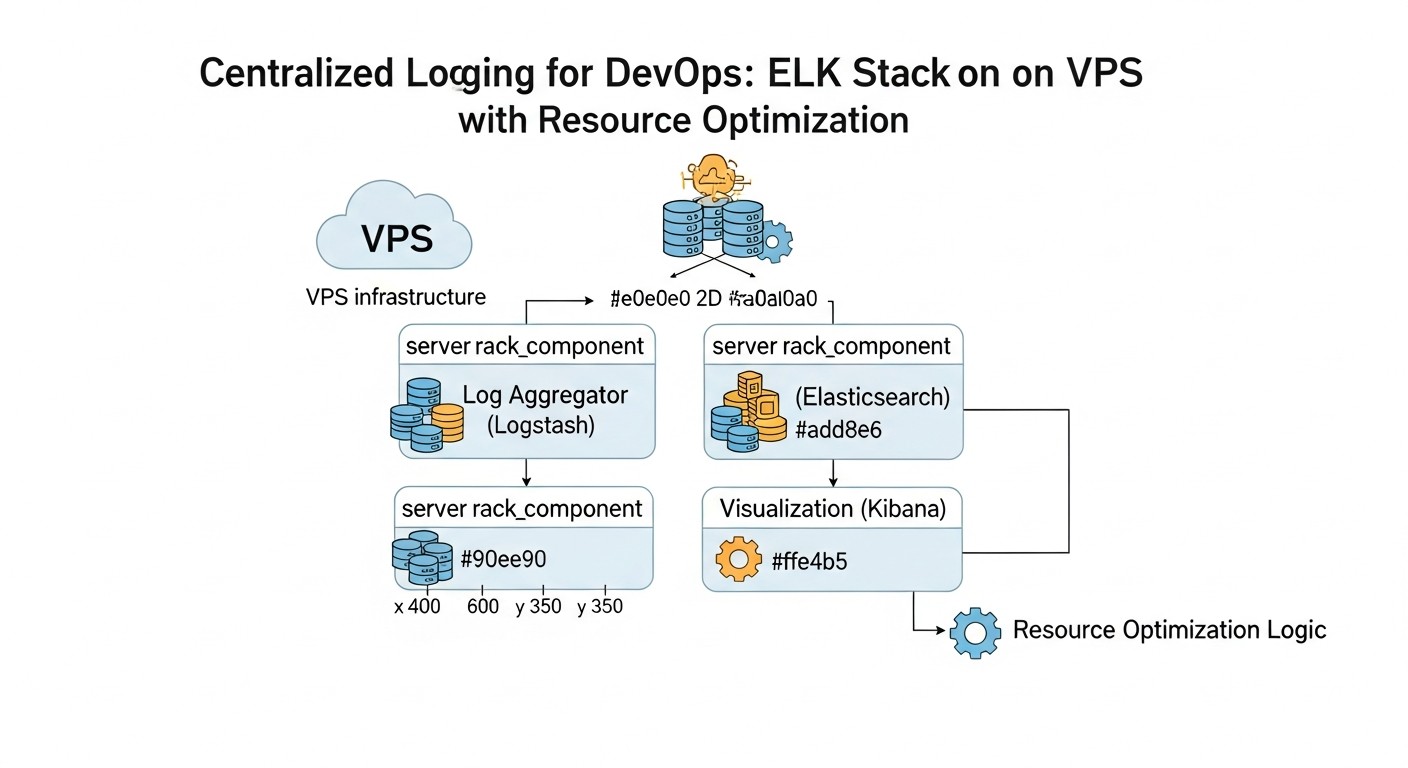
Centralized Logging for DevOps: ELK Stack on VPS with Resource Optimization (Relevant for 2026)
TL;DR
- In 2026, centralized logging based on the ELK Stack remains critically important for DevOps, ensuring transparency and prompt response in distributed systems.
- Deploying ELK on a VPS requires careful resource optimization to achieve stable performance and minimize costs, especially when dealing with large volumes of data.
- Key optimization aspects include proper JVM memory allocation for Elasticsearch and Logstash, index configuration (ILM, data streams), and efficient use of Beats for log collection.
- Choosing the right VPS provider and configuration (CPU, RAM, NVMe SSD) is critical for performance, while also considering hidden costs and scalability options.
- Implementing security practices (TLS, authentication) and regular monitoring of the ELK Stack is not an option, but a necessity for maintaining system reliability.
- Despite the emergence of new tools, ELK remains relevant due to its flexibility, powerful analytical capabilities, and developed community, especially for teams seeking a balance between control and cost.
- This article provides a step-by-step guide, practical tips, calculations, and recommendations for successful ELK implementation and optimization on a VPS.
Introduction
In the 2026 DevOps world, where microservices, containerization, and serverless architectures dominate, the ability to quickly understand what is happening in your distributed system is no longer just an advantage, but an absolute necessity. Applications are becoming increasingly complex, and their components are scattered across numerous servers, containers, and cloud functions. Manually reviewing logs on each node is not only inefficient but practically impossible, especially when dealing with hundreds or thousands of events per second.
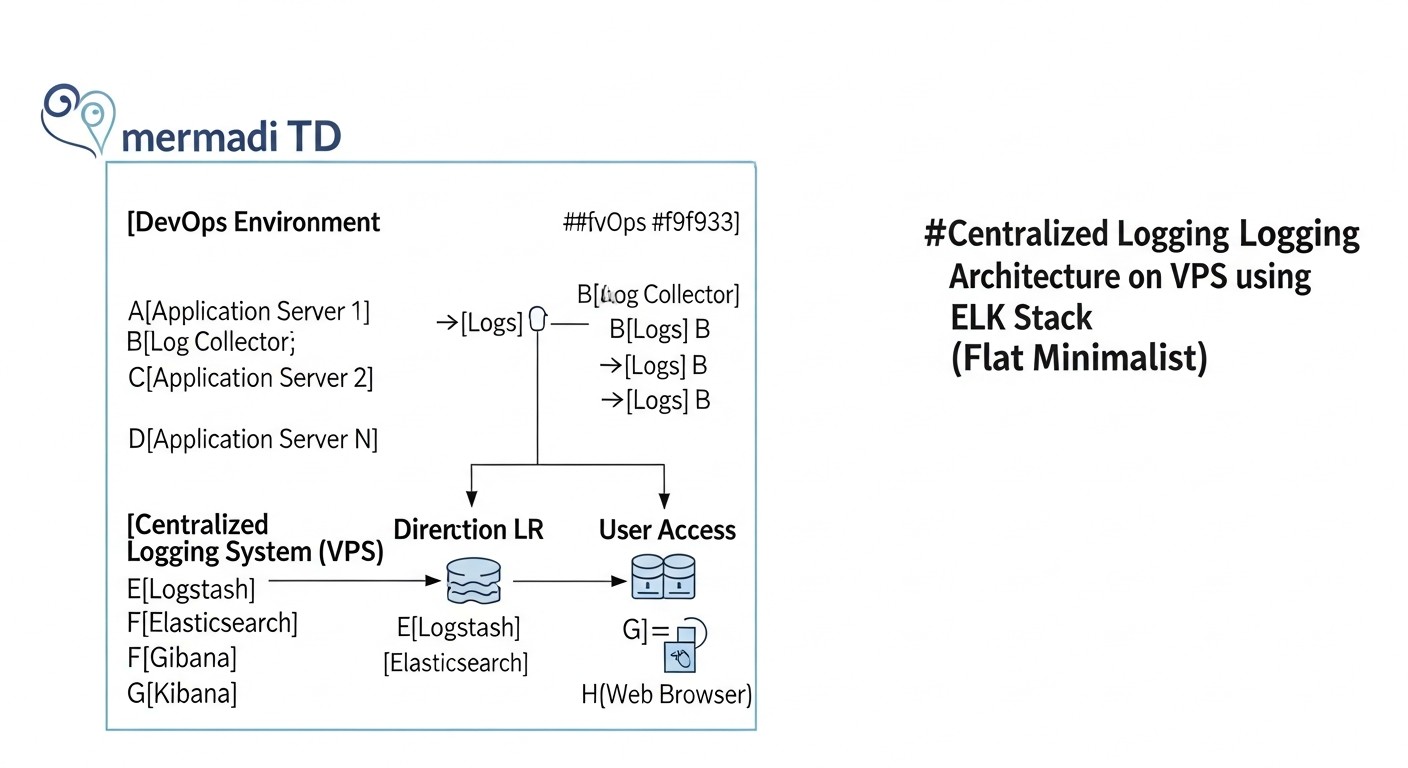
This is where centralized logging comes into play. It allows you to collect all logs from various sources into a single repository, index them, analyze, and visualize them in real-time. This provides DevOps teams, developers, and system administrators with unprecedented transparency, accelerates the debugging process, helps identify anomalies, and enables informed decisions for performance and security optimization.
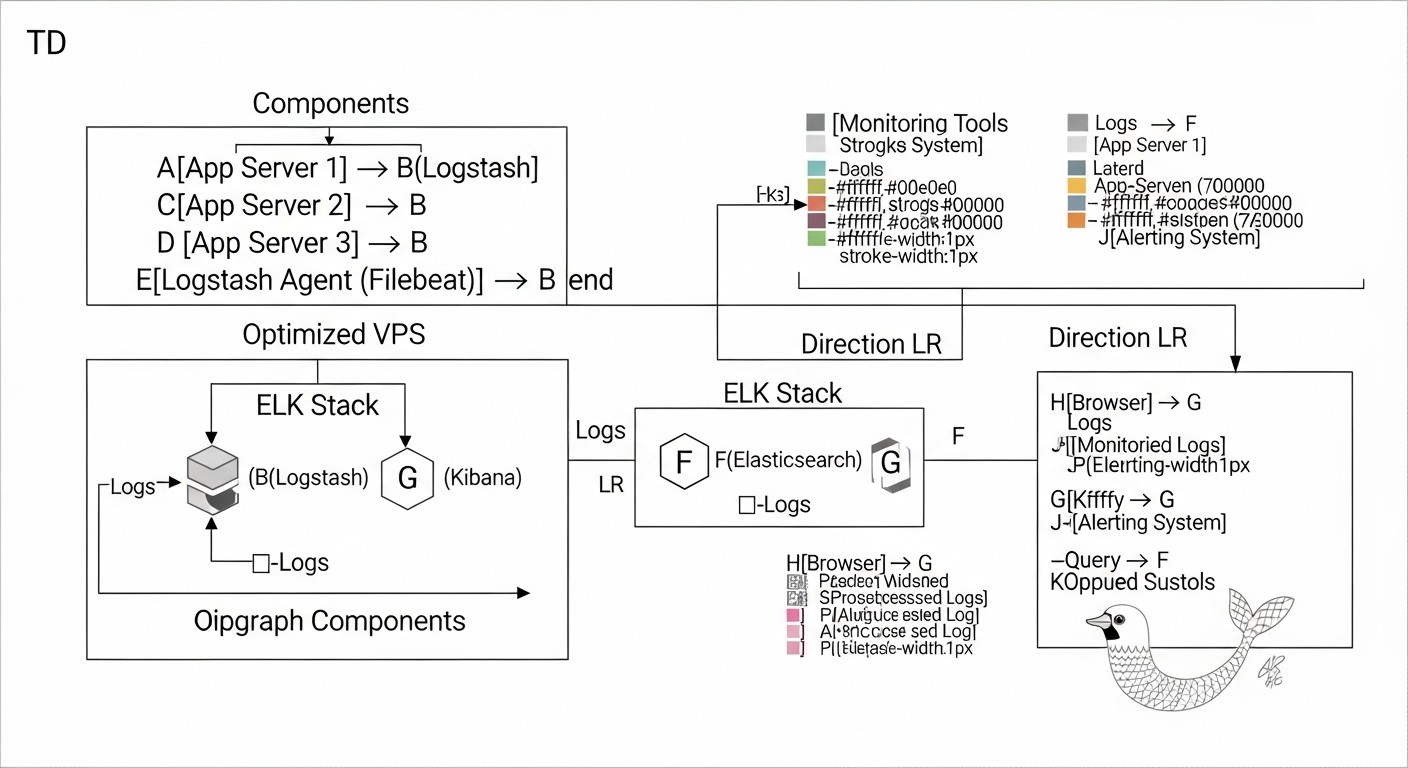
Among the many available solutions, the ELK Stack (Elasticsearch, Logstash, Kibana) remains one of the most popular and powerful tools for these purposes. Its flexibility, openness, and extensive community have made it a de facto standard for many companies, from startups to large enterprises. However, deploying ELK on a Virtual Private Server (VPS) comes with certain challenges, the main one being resource optimization. A VPS, by its nature, offers limited resources compared to dedicated servers or large cloud instances, and ELK, being a rather resource-intensive stack, requires fine-tuning for efficient operation in such conditions.
This article is intended for DevOps engineers, Backend developers, SaaS project founders, system administrators, and technical directors of startups who aim to build a reliable and cost-effective centralized logging system. We will not engage in marketing bullshit. Instead, we will delve into the practical aspects of deploying, configuring, and, most importantly, optimizing the ELK Stack on a VPS so that you can get the most out of your limited resources. We will cover current trends for 2026, provide concrete examples, commands, and calculations based on real-world experience, so that every piece of advice can be immediately applied in practice.
Key problems this article addresses:
- Deployment Complexity: Provides step-by-step instructions for installing and basic configuration of ELK on a VPS.
- High Resource Consumption: Details optimization methods for each component of the stack.
- Lack of Cost Understanding: Offers realistic calculations and cost reduction strategies.
- Scaling Challenges: Discusses approaches to scaling ELK in a VPS environment.
- Security: Emphasizes the importance and suggests basic steps for data protection.
- Lack of Practical Advice: Includes real-world use cases, common errors, and their solutions.
By the end of this article, you will have a deep understanding of how to effectively use the ELK Stack for centralized logging on a VPS, transforming a chaotic stream of logs into a valuable source of information for decision-making.
Key Criteria and Selection Factors for a Logging Solution
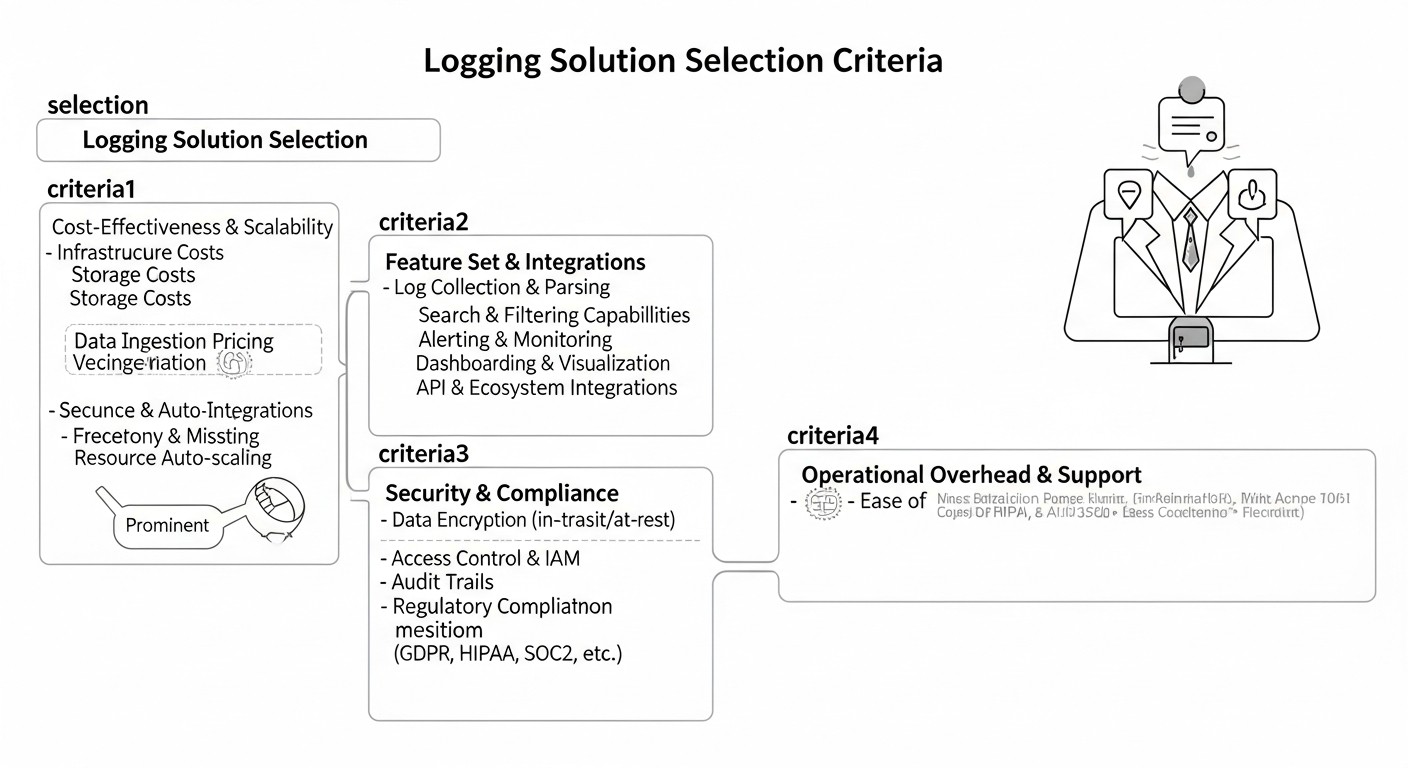
Choosing and deploying a centralized logging system is an investment that should pay off by increasing operational efficiency and reducing incident resolution time. In 2026, as data volumes continue to grow and demands for response speed become stricter, it is especially important to consider a number of key criteria when selecting and configuring your solution. These factors directly impact the system's performance, cost, security, and usability.
1. Scalability
Why it's important: Your logging system must grow with your application. If today you process 100 logs per second, tomorrow it could be 1000 or 10,000. A solution that cannot scale horizontally or vertically will quickly become a bottleneck. On a VPS, this means you must be able to easily expand resources (CPU, RAM, disk) or, ideally, distribute the load across multiple VPS instances.
How to evaluate:
- Horizontal scalability: How easy is it to add new nodes (Elasticsearch, Logstash, Kibana) to distribute the load? The ELK Stack supports this well, but for a VPS, it means additional costs for new VPS instances.
- Vertical scalability: How well does the solution utilize additional resources on a single VPS? (For example, Elasticsearch scales well vertically, but up to a certain limit).
- Performance with data growth: How does the system behave with increasing incoming log volume and query count?
2. Performance
Why it's important: Logs must be collected, indexed, and available for search almost in real-time. Delays of several minutes can be critical for detecting and resolving problems. Slow search or visualization tires users and reduces the system's value.
How to evaluate:
- Ingestion speed: The number of logs the system can process per second.
- Search speed: The time required to execute queries and retrieve results.
- Visualization speed: Dashboard and chart loading time in Kibana.
- Resource utilization: How efficiently does the solution use CPU, RAM, disk I/O during peak loads? This is especially important for a VPS, as resources are limited.
3. Cost
Why it's important: For startups and SaaS projects operating on a VPS, budget is king. Cost includes not only direct VPS expenses but also licenses (if applicable), engineer time for setup and support, and potential hidden costs (traffic, backups). The ELK Stack, being open-source, is economical in terms of licenses but requires significant investment in infrastructure and engineer time.
How to evaluate:
- Direct infrastructure costs: Monthly VPS cost (CPU, RAM, Storage, Network).
- Licensing fees: For ELK, this could be Elastic Cloud or extended commercial X-Pack features. For a VPS, the free version is usually used.
- Operational costs: Engineer time for deployment, configuration, monitoring, maintenance, upgrades.
- Hidden costs: Cost of traffic, backups, monitoring tools.
4. Ease of Use & Management
Why it's important: Even the most powerful solution is useless if it's difficult to set up, use, or maintain. An intuitive interface, good documentation, and ease of management reduce the learning curve and increase team productivity.
How to evaluate:
- Ease of installation and configuration: How quickly can a basic system be set up?
- Interface: How intuitive is the interface for searching, analyzing, and visualizing logs (Kibana)?
- Documentation and community: Availability of quality documentation and an active community for support.
- Automation capabilities: Support for Infrastructure as Code (IaC) for deployment and management.
5. Security
Why it's important: Logs often contain sensitive information: IP addresses, user data, stack trace errors that can reveal architectural details. Insufficient logging system security can lead to data breaches and compliance violations.
How to evaluate:
- Authentication and authorization: Support for role-based access, integration with LDAP/AD.
- Encryption: Support for TLS/SSL for data transfer between components and clients.
- Data access control: Ability for granular control over access to indices and documents.
- Auditing: Logging of user actions and configuration changes.
6. Flexibility & Extensibility
Why it's important: Every application is unique. A logging system must be flexible enough to adapt to your specific log formats, data sources, and analysis needs. The ability to integrate with other tools (monitoring, alerting) is also very important.
How to evaluate:
- Support for various log formats: JSON, Syslog, Apache, Nginx, arbitrary text.
- Plugins and connectors: Availability of plugins for Logstash, Beats for various data sources.
- API: Presence of a powerful API for programmatic data interaction.
- Integration: Ability to integrate with alerting systems (Slack, PagerDuty), monitoring (Prometheus, Grafana).
7. Data Retention & Lifecycle Management
Why it's important: Storing logs indefinitely is expensive and not always necessary. It is essential to define a data retention policy (e.g., 7 days hot logs, 30 days warm, 90 days cold) and have a mechanism for automatically moving or deleting old data. For a VPS, this is critical as disk space is limited.
How to evaluate:
- Indexing policies: Support for Index Lifecycle Management (ILM) or similar mechanisms.
- Storage management: Ability to use different storage types (hot/cold) or automatically delete old indices.
- Snapshots and backups: Presence of built-in mechanisms for creating backups.
8. Monitoring & Alerting
Why it's important: The logging system itself is a critically important part of the infrastructure. Its status must be monitored, and alerts must be configured for critical events detected in the logs. These can be errors, anomalies, or threshold breaches.
How to evaluate:
- Built-in monitoring: Presence of tools for monitoring the ELK Stack's own health.
- Alerting flexibility: Ability to create complex alerting rules based on log data and send them to various notification systems.
- Integration with other monitoring systems: Open APIs for exporting ELK health metrics.
By considering these criteria, you can make an informed decision on how best to build your centralized logging system, especially in a resource-constrained VPS environment.
Comparative Table of Logging Solutions (Relevant for 2026)
In 2026, the market for centralized logging solutions offers a wide range of tools, each with its strengths and weaknesses. For DevOps engineers and SaaS project founders who often operate on VPS with limited budgets, choosing the optimal stack becomes critically important. Below is a comparative table of the most popular solutions, focusing on their applicability in a VPS environment and current characteristics.
| Criterion | ELK Stack (Open Source) | Loki + Grafana | Splunk Free/Light | CloudWatch Logs (AWS) | Elastic Cloud (Managed ELK) |
|---|---|---|---|---|---|
| Architecture | Distributed (Elasticsearch, Logstash, Kibana, Beats). Requires administration. | Centralized Loki (stores only metadata) + Grafana. Easier to administer. | Monolithic/Distributed (indexes, forwarders). Proprietary. | Fully managed AWS cloud service. | Fully managed Elastic SaaS platform. |
| Data Type | Structured and unstructured logs, metrics, APM, Security. | Unstructured logs (as text), metrics. | Structured and unstructured logs, metrics. | Logs, AWS metrics. | Structured and unstructured logs, metrics, APM, Security. |
| VPS Deployment Model | Yes, possible. Requires significant resource optimization and manual management. | Yes, much less resource-intensive than ELK. Easier to deploy on a single VPS. | Limited (free version up to 500 MB/day). Difficult on VPS. | No, only in AWS cloud. | No, it's SaaS. |
| Resource Optimization on VPS | High demand for RAM and CPU, especially for Elasticsearch. Requires deep JVM, ILM, shard tuning. | Low demand for RAM and CPU, as Loki indexes only metadata and uses object storage (S3-compatible). | High demand, not feasible for free versions on VPS. | Not applicable (managed by AWS). | Not applicable (managed by Elastic). |
| Cost (estimated 2026, on VPS) | $20-100/month for VPS (8-16GB RAM, 4-8 vCPU, 200-500GB NVMe). Depends on log volume. | $10-50/month for VPS (4-8GB RAM, 2-4 vCPU, 100-200GB NVMe) + S3 storage cost (a few $). | Free up to 500 MB/day. Enterprise from $1000+/month. Not for VPS. | Depends on log volume and queries. For example, $30-150/month for 100GB logs/month. | From $70/month for a basic cluster (8GB RAM, 2 vCPU) to thousands. |
| Ingestion Speed (hypothetical) | High (tens of thousands of events/sec with proper configuration). | Very high (tens-hundreds of thousands of events/sec, as only labels are indexed). | High (with sufficient resources). | High. | Very high. |
| Search Speed | Very high for structured data. Full-text search. | Fast search by labels. Searching log content is slower. | Very high, powerful SPL language. | Good for simple queries, slower for complex ones. | Very high. |
| Visualization/Analytics | Kibana: powerful dashboards, charts, discover, APM, Security. | Grafana: flexible dashboards, metrics, traces, logs. | Splunk UI: very powerful, but complex to learn. | CloudWatch Dashboards: basic, but sufficient for AWS monitoring. | Kibana: full functionality. |
| Lifecycle Management (ILM) | Yes, built-in ILM for automatic index management (hot/warm/cold/delete). | Managed by S3 policies and Loki configuration. | Yes. | Configurable retention policies. | Yes, full ILM. |
| Security | Basic (X-Pack Security) - authentication, authorization, TLS. Advanced features are paid. | Grafana authentication, TLS, integration with IAM for S3. | Built-in, very powerful. | Integration with AWS IAM, KMS. | Full X-Pack security. |
| Learning Curve | Medium/High (installation, configuration of all components, optimization). | Low/Medium (easier to install, Grafana is familiar to many). | High (SPL language, concepts). | Low (for basic use). | Low (for use, but not for administration). |
| Who it's for (on VPS) | Teams needing deep analytics, full-text search, flexibility, and full data control, willing to invest time in administration. | Teams needing a simple, lightweight, and cost-effective way to centralize logs for debugging and basic monitoring, already using Grafana. | Large enterprises with big budgets, not for VPS deployment. | Teams whose infrastructure is entirely in AWS and who do not need deep log analysis beyond AWS metrics. | Teams needing the full power of ELK, but without the administration headache, willing to pay for convenience. |
Table Conclusions:
- ELK Stack (Open Source) remains a powerful and flexible choice for those willing to invest in its administration and optimization. On a VPS, this requires special attention to resources.
- Loki + Grafana comes to the forefront as a lighter and more economical alternative for VPS, especially if the main task is quick log viewing and correlation with metrics, rather than deep full-text analytics. Its storage model (indexing only metadata) significantly reduces RAM and CPU requirements on the server.
- Splunk and CloudWatch Logs are solutions for different scales and ecosystems, not optimal for self-deployment on a VPS.
- Elastic Cloud is an excellent option for those who want ELK without administration, but the price is significantly higher than self-deployment on a VPS.
For the purposes of this article, we will focus on the ELK Stack (Open Source) as the most flexible and controllable option for VPS deployment, with an emphasis on how to make it efficient even with limited resources.
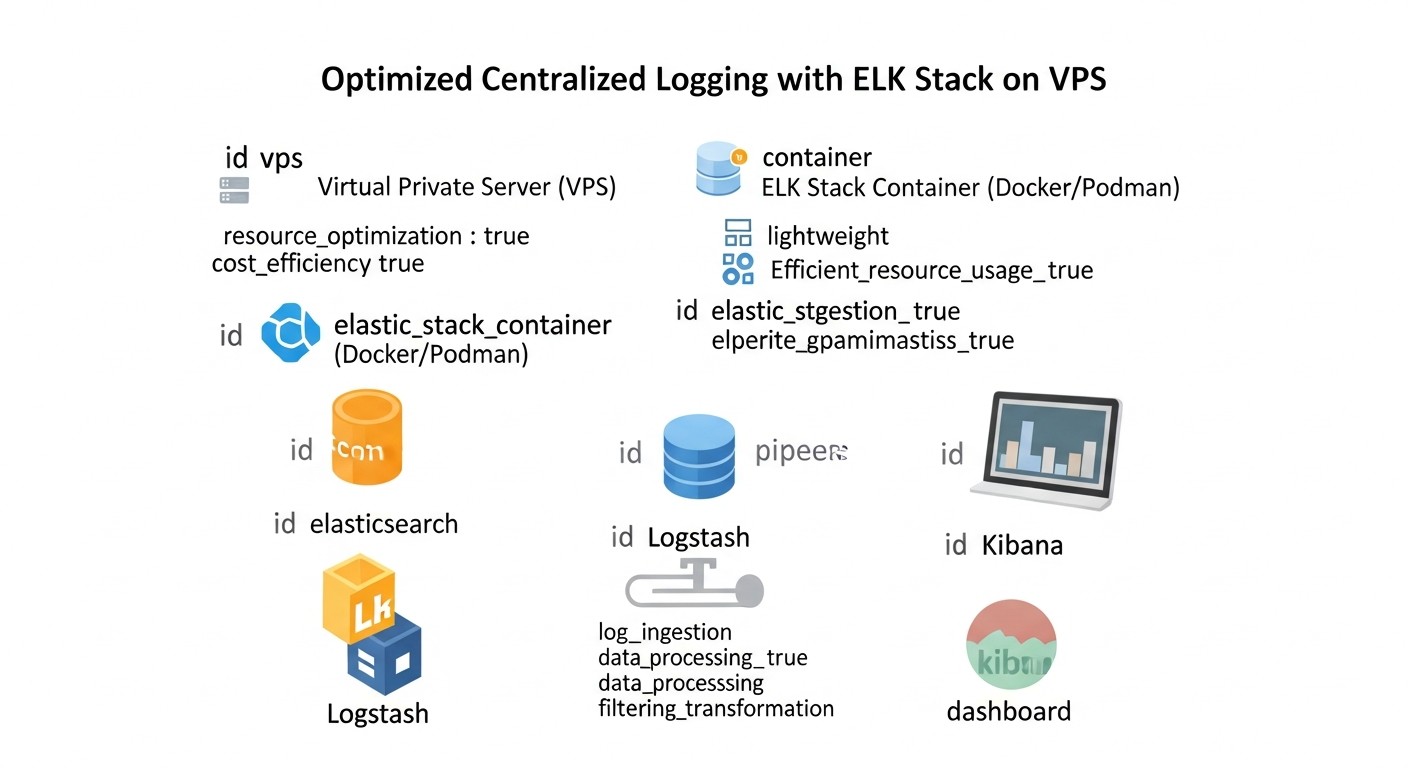
Detailed Overview of ELK Stack Components and Alternatives
The ELK Stack is an acronym for three key components: Elasticsearch, Logstash, and Kibana. In modern interpretation, Beats—a family of lightweight data shippers—are often added. Let's look at each of them in more detail, and also touch upon the main alternatives mentioned in the comparative table.
1. Elasticsearch: The Heart of Storage and Search
Elasticsearch is a distributed, RESTful search and analytics engine built on Apache Lucene. It's the engine that stores all your logs, indexes them, and provides lightning-fast search and data aggregation. For a DevOps engineer, this means the ability to quickly find relevant events among billions of records.
- Pros:
- Speed: Near real-time for indexing and searching.
- Scalability: Horizontal scaling by adding new nodes to the cluster.
- Flexibility: Support for structured and unstructured data, powerful query language (DSL).
- Aggregations: Ability to perform complex analytical queries, build charts and dashboards.
- Ecosystem: Rich ecosystem of plugins and integrations.
- Cons:
- Resource-intensive: Requires a lot of RAM and CPU, especially for indexing and intensive queries. The JVM process can consume gigabytes of memory.
- Management complexity: Managing a cluster, shards, replicas, and indices requires specific knowledge.
- Configuration sensitivity: Incorrect settings can lead to instability or data loss.
- Who it's for: For projects that need powerful full-text search, complex analytics, and high data processing speed. It's an ideal choice if you are willing to invest time in optimization and administration.
- Examples of VPS use:
- Storing and searching logs from web servers (Nginx, Apache), applications (Python, Node.js, Go), databases.
- Security analysis (SIEM-like functions for small teams).
- Collecting metrics and storing them for subsequent analysis.
Optimization for VPS: The key aspect is JVM memory management. It is recommended to allocate up to 50% of available RAM on the VPS, but no more than 30.5 GB, to avoid compressed pointers. ILM (Index Lifecycle Management) is also important for automatically deleting old indices and using data streams for efficient data management.
2. Logstash: The Data Processing Pipeline
Logstash is a powerful, flexible, and open pipeline for collecting, processing, and forwarding data (ETL). It can ingest data from various sources, transform it (parsing, enrichment, filtering), and send it to various destinations, most often to Elasticsearch.
- Pros:
- Flexible sources/destinations: Supports a huge number of inputs (file, http, beats, kafka, redis) and outputs (elasticsearch, s3, email).
- Powerful processing: Filters (grok, mutate, date, geoip) allow parsing complex logs, adding context, normalizing data.
- Resilience: Support for persistent queues and dead-letter queues to prevent data loss.
- Cons:
- Resource-intensive: Logstash, especially with many complex Grok filters, can consume significant CPU and RAM resources.
- Configuration complexity: Writing efficient and fault-tolerant configurations can be challenging.
- Performance: Slower than Beats for direct log collection.
- Who it's for: For tasks requiring complex data processing before indexing, aggregation from multiple sources, or log enrichment.
- Examples of VPS use:
- Parsing unstructured text logs into structured JSON.
- Enriching logs with IP addresses (geolocation) or data from other sources.
- Aggregating logs from Kafka or Redis before sending to Elasticsearch.
Optimization for VPS: Use Beats for direct log collection, and Logstash only for complex transformations. Optimize Grok patterns (make them as precise as possible). Configure the number of pipeline workers and batch size. Reduce the JVM heap size for Logstash if it's not performing very intensive transformations.
3. Kibana: The Interface for Visualization and Analysis
Kibana is a powerful tool for visualizing and exploring data stored in Elasticsearch. It provides an intuitive web interface for creating dashboards, charts, tables, and interactive reports, allowing users to quickly analyze logs and metrics.
- Pros:
- Visualization: Wide range of visualization types (histograms, pie charts, maps, tables).
- Dashboards: Ability to create interactive dashboards from various visualizations.
- Discover: Powerful interface for searching and filtering raw logs.
- Modules: Built-in modules for APM, Security, Observability.
- Cons:
- Resource-intensive: Can be demanding on RAM and CPU when building complex dashboards with large amounts of data.
- Dependency on Elasticsearch: Without a running Elasticsearch, Kibana is useless.
- Learning curve: Creating complex visualizations requires some learning.
- Who it's for: For anyone who wants to get a clear overview of their data, create reports, and monitor system status.
- Examples of VPS use:
- Monitoring errors and warnings in real-time.
- Analyzing web server traffic.
- Tracking application performance.
Optimization for VPS: Place Kibana on the same VPS as Elasticsearch to minimize network latency. Use Nginx or Caddy as a reverse proxy for caching static files and adding SSL. Limit the number of concurrently open dashboards and complex visualizations.
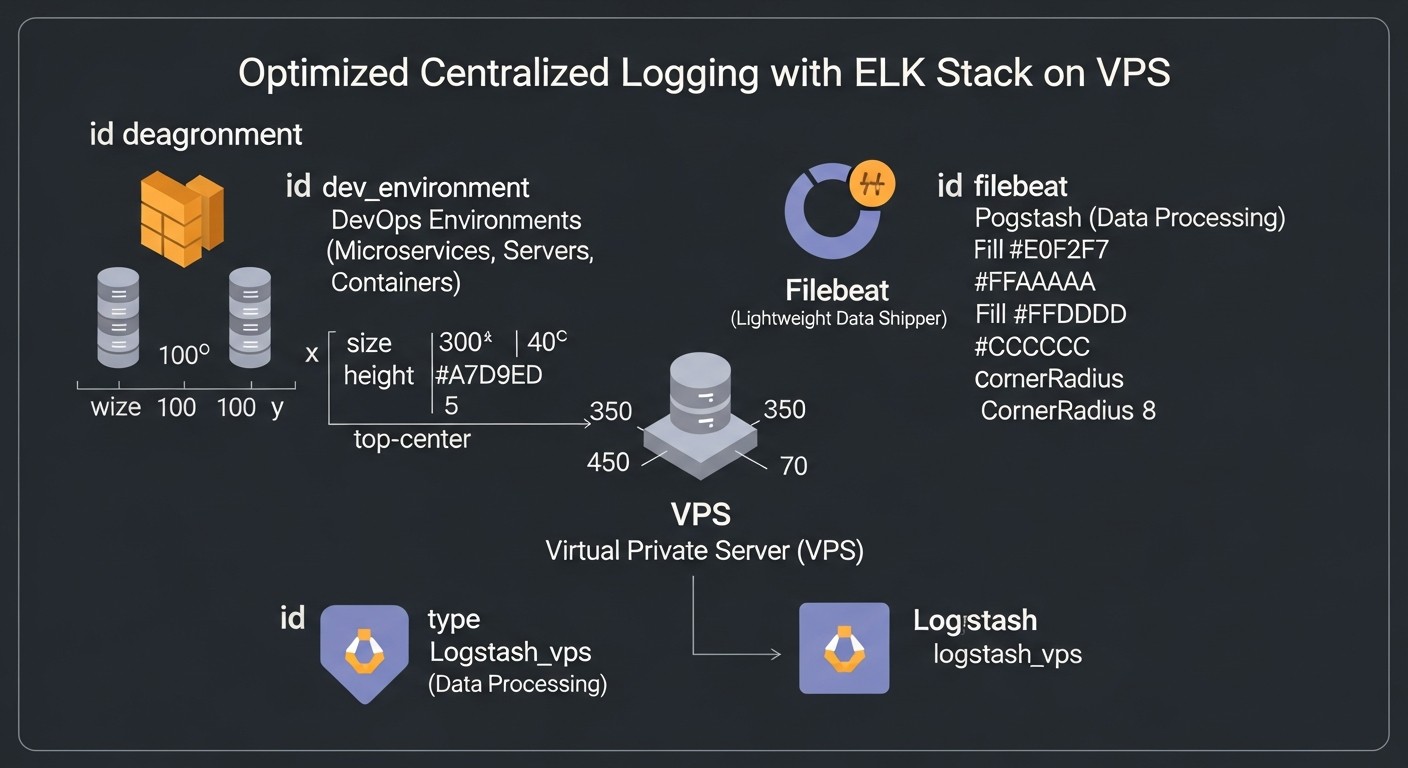
4. Beats: Lightweight Data Shippers
Beats are a family of lightweight, single-purpose agents that are installed on your servers to collect various types of data (logs, metrics, network traffic, security data) and forward them to Elasticsearch or Logstash. Filebeat for logs and Metricbeat for metrics are the most commonly used.
- Pros:
- Lightweight: Low resource consumption, making them ideal for installation on production servers.
- Reliability: Guaranteed data delivery, resilience to network failures.
- Modularity: Specialized Beats for different data types and sources (Filebeat, Metricbeat, Packetbeat, Heartbeat, Auditbeat, Winlogbeat).
- Easy configuration: Configuration in YAML files, ready-to-use modules for popular services.
- Cons:
- Limited processing: Beats perform basic processing (e.g., JSON parsing) but are not suitable for complex transformations like Logstash.
- Multiple agents: Different Beats are required for different data types, which can complicate management on a large number of servers.
- Who it's for: For anyone who wants to efficiently and reliably collect data from multiple servers and containers with minimal resource consumption.
- Examples of VPS use:
- Filebeat for collecting Nginx logs, Docker containers, system logs.
- Metricbeat for collecting CPU, RAM, disk, network metrics, as well as service metrics (MySQL, Redis, Docker).
Optimization for VPS: Use Beats instead of Logstash at log sources if complex processing is not required. Configure `scan_frequency` and `harvester_buffer_size` to balance freshness and resource consumption. Limit the number of metrics and logs collected to avoid overloading the system.
5. Alternatives: Loki + Grafana
As noted in the table, Loki from Grafana Labs is a serious competitor to ELK, especially for resource-constrained scenarios and a focus on logs in the context of metrics.
- Pros:
- Resource efficiency: Loki indexes only log labels, not their content, which makes it extremely lightweight. Logs are stored in object storage (S3, GCS) or on local disk.
- Grafana integration: Ideal for teams already using Grafana for metric monitoring. Logs and metrics are easily correlated.
- Simplicity: Easier to deploy and manage than ELK.
- LogQL query language: Similar to PromQL, which makes it easier to learn for those already familiar with Prometheus.
- Cons:
- Limited full-text search: Searching log content is less efficient than in Elasticsearch and requires scanning large volumes of data.
- Less powerful analytics: Loki is not designed for performing complex aggregations and analytical queries like Elasticsearch.
- Smaller ecosystem: The community and set of integrations are smaller than ELK's.
- Who it's for: For teams needing a simple and cost-effective way to centralize logs for debugging and basic monitoring, especially if they already use Grafana for metrics. Excellent for deployment on small VPS instances.
- Examples of VPS use:
- Collecting logs from Docker containers and Kubernetes clusters (with Promtail).
- Basic error and warning monitoring.
- Correlating logs with metric graphs in Grafana for quick troubleshooting.
The choice between ELK and Loki+Grafana often comes down to a trade-off between analytical power and resource efficiency. For deep analysis and full-text search, ELK remains the leader, but for quick log viewing and budget deployments, Loki becomes a very attractive alternative.
Practical Tips and Recommendations for Deploying ELK on VPS with Resource Optimization
Deploying the ELK Stack on a VPS is an art of balancing functionality with available resources. The goal is to get maximum benefit with minimal cost. Below are step-by-step instructions and recommendations based on experience working with ELK in constrained environments.
1. Choosing a VPS Provider and Configuration (2026)
In 2026, the VPS provider market offers a wide choice. For ELK, the following parameters are critical:
- RAM: Minimum 8 GB for a minimally viable stack. 16 GB or more is the recommended starting point for a production environment. Elasticsearch particularly loves memory.
- CPU: Minimum 2-4 vCPU. The more cores, the better for parallel query processing and indexing.
- Disk: Only NVMe SSD. Regular SSDs or HDDs will not cope with Elasticsearch's intensive I/O operations. Minimum 200-500 GB, depending on log volume and retention policy.
- Network: Stable and fast network channel (minimum 1 Gbit/s) without hidden traffic restrictions, if you plan to collect logs from many external sources.
Recommended providers (2026): Hetzner Cloud, Vultr, DigitalOcean, OVHcloud. They offer a good price/performance ratio for NVMe SSD and sufficient RAM.
Example configuration for a start (Hetzner Cloud CX41/CX51):
- 8-16 GB RAM
- 4-8 vCPU
- 200-320 GB NVMe SSD
- Price: $25 - $50/month (estimated 2026)
2. Preparing the VPS for ELK Installation
Before installing ELK components, the operating system needs to be configured. Ubuntu Server 22.04 LTS or 24.04 LTS is recommended.
# Update the system
sudo apt update && sudo apt upgrade -y

# Install Java (OpenJDK 17 or newer, relevant for ES 8.x/9.x)
sudo apt install openjdk-17-jdk -y

# Increase file descriptor and memory limits for Elasticsearch
# Add to /etc/sysctl.conf
echo "vm.max_map_count=262144" | sudo tee -a /etc/sysctl.conf
sudo sysctl -p

# Add to /etc/security/limits.conf (for user elasticsearch)
# elasticsearch - nofile 65536
# elasticsearch - memlock unlimited
# (These settings will be applied after creating the elasticsearch user and rebooting)

# Disable swap (recommended for Elasticsearch to avoid performance degradation)
sudo swapoff -a
sudo sed -i '/ swap / s/^\(.*\)$/#\1/g' /etc/fstab

# Install packages for HTTPS repositories
sudo apt install apt-transport-https ca-certificates curl gnupg lsb-release -y

# Add Elastic repository
curl -fsSL https://artifacts.elastic.co/GPG-KEY-elasticsearch | sudo gpg --dearmor -o /usr/share/keyrings/elastic.gpg
echo "deb [signed-by=/usr/share/keyrings/elastic.gpg] https://artifacts.elastic.co/packages/8.x/apt stable main" | sudo tee /etc/apt/sources.list.d/elastic-8.x.list
sudo apt update
3. Installing and Basic Configuration of Elasticsearch
Installation:
sudo apt install elasticsearch -y
Configuration (file /etc/elasticsearch/elasticsearch.yml):
cluster.name: my-elk-cluster(can be left as default, but better to set).node.name: node-1path.data: /var/lib/elasticsearch(ensure this is an NVMe disk).path.logs: /var/log/elasticsearchnetwork.host: 0.0.0.0(for external access, be careful with security!). For a single VPS,localhostor127.0.0.1is sufficient.http.port: 9200discovery.type: single-node(critical for a single VPS to avoid cluster formation attempts).xpack.security.enabled: true(enables basic security in 8.x by default).
Optimizing JVM Heap Size: This is the most important parameter for Elasticsearch on a VPS. Edit /etc/elasticsearch/jvm.options.
Set -Xms and -Xmx to the same value, no more than 50% of total VPS RAM, but not exceeding 30.5 GB.
For example, for a VPS with 16 GB RAM:
-Xms8g
-Xmx8g
Start and check:
sudo systemctl enable elasticsearch
sudo systemctl start elasticsearch
sudo systemctl status elasticsearch
curl -u elastic:your_password https://localhost:9200 # (password is generated on first run)
On the first run of Elasticsearch 8.x with xpack.security.enabled: true, it automatically generates a password for the elastic user and other tokens. You will need to save them.
# After first run (if you forgot or didn't record it)
sudo /usr/share/elasticsearch/bin/elasticsearch-reset-password -u elastic
4. Installing and Basic Configuration of Kibana
Installation:
sudo apt install kibana -y
Configuration (file /etc/kibana/kibana.yml):
server.port: 5601server.host: "0.0.0.0"(or"localhost"if you will use Nginx as a proxy).elasticsearch.hosts: ["https://localhost:9200"]elasticsearch.username: "kibana_system"(user created by ES for Kibana).elasticsearch.password: "YOUR_KIBANA_SYSTEM_PASSWORD"(obtained after ES setup).server.publicBaseUrl: "https://your_domain.com"(if using a domain and SSL).
On the first launch of Kibana, it will ask you to enter a token to connect to Elasticsearch. You can generate it on the Elasticsearch side:
sudo /usr/share/elasticsearch/bin/elasticsearch-create-enrollment-token -s kibana
Then use this token in the Kibana web interface upon first login. After that, Kibana will prompt you to generate a token for the kibana_system user.
Start and check:
sudo systemctl enable kibana
sudo systemctl start kibana
sudo systemctl status kibana
Access via http://your_vps_ip:5601 (or https if configured). Use the elastic login and the password obtained from Elasticsearch.
5. Installing and Basic Configuration of Logstash (optional, use Beats if possible)
Installation:
sudo apt install logstash -y
Configuration (file /etc/logstash/logstash.yml):
http.host: "0.0.0.0"path.data: /var/lib/logstashpath.logs: /var/log/logstash
Optimizing JVM Heap Size: Edit /etc/logstash/jvm.options. For most VPS scenarios, 1-2 GB will be sufficient.
-Xms1g
-Xmx1g
Example of a simple Logstash configuration (file /etc/logstash/conf.d/01-beats-input.conf):
input {
  beats {
    port => 5044
    ssl => true
    ssl_certificate_authorities => ["/etc/logstash/certs/ca.crt"] # Path to your CA
    ssl_certificate => "/etc/logstash/certs/logstash.crt"
    ssl_key => "/etc/logstash/certs/logstash.key"
  }
}

filter {
  # Example of simple JSON parsing
  if [message] =~ /^{.*}$/ {
    json {
      source => "message"
      target => "json_data"
      remove_field => ["message"] # Remove original message if it's entirely JSON
    }
  }
}

output {
  elasticsearch {
    hosts => ["https://localhost:9200"]
    user => "logstash_system" # User for Logstash, created in ES
    password => "YOUR_LOGSTASH_SYSTEM_PASSWORD"
    ssl => true
    ssl_certificate_verification => false # In production, use true and CA for ES
    # index => "my-app-logs-%{+YYYY.MM.dd}" # Old way
    manage_template => false # Use Data Streams
    data_stream_acd => true
  }
}
Important: To work with Elasticsearch 8.x and above, and to ensure security, you need to configure SSL/TLS and authentication. This includes creating certificates and users. Use the logstash_system user for Logstash, whose password is generated in Elasticsearch.
# Generate password for logstash_system user
sudo /usr/share/elasticsearch/bin/elasticsearch-reset-password -u logstash_system
Start and check:
sudo systemctl enable logstash
sudo systemctl start logstash
sudo systemctl status logstash
6. Installing and Basic Configuration of Filebeat (on log source servers)
Install Filebeat on the servers from which you collect logs (not on the VPS with ELK):
# Add Elastic repository (if not already done)
curl -fsSL https://artifacts.elastic.co/GPG-KEY-elasticsearch | sudo gpg --dearmor -o /usr/share/keyrings/elastic.gpg
echo "deb [signed-by=/usr/share/keyrings/elastic.gpg] https://artifacts.elastic.co/packages/8.x/apt stable main" | sudo tee /etc/apt/sources.list.d/elastic-8.x.list
sudo apt update

# Install Filebeat
sudo apt install filebeat -y
Configuration (file /etc/filebeat/filebeat.yml):
- In the
filebeat.inputssection, configure log paths:
filebeat.inputs:
- type: filestream
  id: my-app-logs
  enabled: true
  paths:
    - /var/log/my-app/*.log
  fields:
    service_name: my_application
    env: production
  processors:
    - decode_json_fields:
        fields: ["message"]
        target: "json"
        overwrite_keys: true
        max_depth: 10
        add_error: true
    - add_host_metadata: ~
    - add_cloud_metadata: ~ # If it's a cloud VM
output.logstash:
  hosts: ["your_logstash_vps_ip:5044"]
  ssl.enabled: true
  ssl.verification_mode: none # In production, use full and CA
  # ssl.certificate_authorities: ["/etc/filebeat/certs/ca.crt"] # Path to CA, if using full verification
output.elasticsearch:
  hosts: ["https://your_elasticsearch_vps_ip:9200"]
  username: "filebeat_writer" # User for Filebeat, created in ES
  password: "YOUR_FILEBEAT_WRITER_PASSWORD"
  ssl.enabled: true
  ssl.verification_mode: none # In production, use full and CA
  # ssl.certificate_authorities: ["/etc/filebeat/certs/ca.crt"]
  index: "my-app-logs-%{+YYYY.MM.dd}" # Or use data_stream
  data_stream.namespace: default
  # data_stream.type: logs # For version 8.x+
  # data_stream.dataset: myapp.logs
Important: For direct Filebeat connection to Elasticsearch 8.x, you will need to create a user with appropriate permissions. For example, filebeat_writer with a role that allows writing to data streams.
# Create a user for Filebeat in Elasticsearch
# First, generate a password
sudo /usr/share/elasticsearch/bin/elasticsearch-reset-password -u filebeat_writer
# Then create a role (e.g., via Kibana Dev Tools):
# PUT /_security/role/filebeat_writer_role
# {
#   "cluster": ["monitor"],
#   "indices": [
#     {
#       "names": ["logs-*-*"],
#       "privileges": ["write", "create_index", "manage_ilm"]
#     }
#   ],
#   "applications": [],
#   "run_as": [],
#   "metadata": {},
#   "transient_metadata": {}
# }
# Assign this role to the filebeat_writer user.
Start and check:
sudo systemctl enable filebeat
sudo systemctl start filebeat
sudo systemctl status filebeat
7. System and Network Level Optimization
- File system: XFS or Ext4 is recommended for Elasticsearch. Ensure the disk is mounted with
noatimeandnodiratimeoptions to reduce I/O. - Firewall: Configure UFW or another firewall to restrict access to ports 9200 (Elasticsearch), 5601 (Kibana), and 5044 (Logstash/Beats). Allow access only from trusted IP addresses or via VPN.
sudo ufw allow 22/tcp # SSH
sudo ufw allow 5601/tcp # Kibana
sudo ufw allow 9200/tcp # Elasticsearch (for trusted only)
sudo ufw allow 5044/tcp # Beats/Logstash
sudo ufw enable
# Example Nginx configuration for Kibana
server {
    listen 80;
    server_name your_domain.com;
    return 301 https://$host$request_uri;
}

server {
    listen 443 ssl http2;
    server_name your_domain.com;

    ssl_certificate /etc/letsencrypt/live/your_domain.com/fullchain.pem;
    ssl_certificate_key /etc/letsencrypt/live/your_domain.com/privkey.pem;

    location / {
        proxy_pass http://localhost:5601;
        proxy_set_header Host $host;
        proxy_set_header X-Real-IP $remote_addr;
        proxy_set_header X-Forwarded-For $proxy_add_x_forwarded_for;
        proxy_set_header X-Forwarded-Proto $scheme;

        # Basic authentication (optional)
        # auth_basic "Restricted Content";
        # auth_basic_user_file /etc/nginx/.htpasswd;
    }
}
8. Index Lifecycle Management (ILM)
In 2026, ILM (Index Lifecycle Management) is standard practice for managing data in Elasticsearch. It allows automatically moving indices between "hot," "warm," "cold" phases and deleting them, optimizing disk usage.
Use the Kibana UI (Stack Management -> Index Lifecycle Policies) to create ILM policies. For example:
- Hot phase: Data is actively written and read. Transition to Warm after 7 days.
- Warm phase: Data is read-only. Transition to Cold after 30 days.
- Cold phase: Data is rarely read, possibly compressed. Transition to Delete after 90 days.
- Delete phase: Index deletion after 180 days.
Ensure your Filebeat or Logstash are configured to use Data Streams, which automatically create indices linked to ILM policies.
These practical tips will help you not only deploy the ELK Stack on a VPS but also significantly optimize its operation, extending the life of your resources and ensuring the stability of your logging system.
Common Errors When Working with ELK on VPS and How to Avoid Them
Deploying and operating the ELK Stack, especially on limited VPS resources, is fraught with many pitfalls. Configuration errors or incorrect assumptions can lead to instability, data loss, performance degradation, or unnecessarily high costs. Here are five of the most common mistakes and how to prevent them:
1. Insufficient Resource Allocation (RAM and I/O)
Error: Attempting to run a full-fledged ELK Stack on a VPS with 2-4 GB RAM and a regular HDD/SATA SSD. Elasticsearch, Logstash, and Kibana are resource-intensive applications. Elasticsearch is particularly sensitive to lack of RAM and slow disk I/O.
Consequences:
- Constant OutOfMemoryError in Elasticsearch and Logstash.
- Slow indexing and searching, delays in log ingestion.
- Kibana "freezing," inability to build dashboards.
- Data loss due to queue overflow and the system's inability to process the incoming stream.
- Overall system instability, frequent service restarts.
How to avoid:
- Start with adequate resources: Minimum 8 GB RAM and 4 vCPU, definitely NVMe SSD. For a production environment with a moderate log stream (several thousand events/sec), consider 16 GB RAM.
- Optimize JVM Heap: Set
-Xmsand-Xmxfor Elasticsearch to 50% of available RAM, but no more than 30.5 GB. For Logstash, 1-2 GB is usually sufficient. - Monitoring: Carefully monitor CPU, RAM, disk I/O, and JVM Heap usage with Metricbeat and Kibana Stack Monitoring.
- Use ILM: Automatically delete old indices to avoid filling up the disk.
2. Incorrect JVM Heap Size Configuration
Error: Setting -Xms and -Xmx for Elasticsearch too high (more than 50% RAM) or too low. Often, beginners set it to the maximum or forget entirely.
Consequences:
- If more than 50% RAM: The operating system will be forced to use swap, which will catastrophically slow down Elasticsearch and lead to "thrashing" (constant data exchange between RAM and disk).
- If too low: Elasticsearch will not be able to effectively use Lucene caches, which will slow down searching and indexing.
- Different
-Xmsand-Xmx: Will lead to frequent and long Garbage Collections.
How to avoid:
- 50% Rule: Allocate exactly 50% of available physical RAM to the JVM Heap, but never exceed 30.5 GB (due to compressed ordinary object pointers).
- Equal values: Always set
-Xmsand-Xmxto the same value. - Disable swap: Ensure swap is completely disabled on the VPS where Elasticsearch is running.
- Monitor GC: Use Kibana Stack Monitoring to track garbage collection time and frequency.
3. Lack of Security (open ports, weak passwords)
Error: Leaving Elasticsearch (9200) and Kibana (5601) ports open to the world without authentication and SSL/TLS. Using default or weak passwords.
Consequences:
- Data breach: Logs may contain sensitive information that becomes accessible to attackers.
- Unauthorized access: Attackers can modify or delete your data.
- DDoS attacks: Open ports can become targets for attacks.
- System compromise: Through vulnerabilities in ELK, access to the entire system can be gained.
How to avoid:
- Use SSL/TLS: Encrypt all traffic between ELK components and between clients and Kibana/Elasticsearch. Use Let's Encrypt for free certificates.
- Enable X-Pack Security: In Elasticsearch 8.x, it is enabled by default. Use strong, randomly generated passwords for all users.
- Firewall: Restrict access to ELK ports only from trusted IP addresses or use VPN/SSH tunnels.
- Nginx/Caddy as a proxy: Use a reverse proxy for Kibana for centralized SSL management and, if necessary, adding basic HTTP authentication.
4. Ignoring Index Lifecycle Management (ILM)
Error: Allowing Elasticsearch to store all logs indefinitely without configuring policies for deleting old data.
Consequences:
- Rapid disk overflow: Logs are constantly generated, and without ILM, the disk will quickly fill up.
- Performance degradation: The more data in indices, the slower searching and indexing.
- Unforeseen costs: The need to constantly increase disk space on the VPS.
- Manual management: The need to manually delete old indices, which is time-consuming and prone to errors.
How to avoid:
- Configure ILM from the start: Define a log retention policy (e.g., 7 days "hot," 30 days "warm," 90 days "cold," then deletion) and create corresponding policies in Kibana.
- Use Data Streams: This is the recommended way for logging in Elasticsearch 7.x/8.x+, which simplifies index management with ILM.
- Disk monitoring: Regularly check free disk space. Configure alerts when thresholds are reached (e.g., 80% full).
5. Overuse of Logstash for Simple Tasks
Error: Using Logstash for all log collection and forwarding tasks, even if minimal processing is required.
Consequences:
- Excessive resource consumption: Logstash is a JVM application that consumes significantly more RAM and CPU than lightweight Beats.
- Architectural complexity: Adding an extra link to the data processing pipeline increases potential points of failure.
- Delays: Logstash can introduce additional delays into the pipeline if it is overloaded or its filters are not optimized.
How to avoid:
- Prefer Beats: Use Filebeat or Metricbeat to collect logs and metrics directly from sources and send them to Elasticsearch. They are much more lightweight and efficient.
- Use Logstash only for complex transformations: If you need complex Grok parsing, data enrichment from external sources, or aggregation from many different systems, then Logstash is justified.
- Optimize Logstash configuration: If Logstash is necessary, optimize its filters (e.g., make Grok patterns as precise as possible), configure
pipeline.workersandpipeline.batch.size.
By avoiding these common mistakes, you will significantly increase the stability, performance, and security of your centralized logging system on the ELK Stack, even with limited VPS resources.
Checklist for Practical ELK Application on VPS
This checklist will help you systematize the process of deploying and optimizing the ELK Stack on a VPS, ensuring stable and efficient operation of your centralized logging system.
Phase 1: Planning and Preparation
- Define resource requirements:
- Estimate approximate log volume (events per second, GB per day).
- Determine required log retention time.
- Calculate necessary RAM, CPU, and disk space for the VPS.
- Choose a VPS provider:
- Ensure NVMe SSD and sufficient RAM/CPU are available.
- Check tariffs and scaling capabilities.
- Select ELK Stack version:
- The latest stable version is recommended (e.g., 8.x or newer in 2026).
- Check compatibility with your OS and Java.
- Prepare domain and SSL certificates:
- Register a domain name for Kibana (e.g.,
logs.yourdomain.com). - Obtain an SSL certificate (e.g., using Let's Encrypt).
- Register a domain name for Kibana (e.g.,
Phase 2: VPS Setup
- Install the operating system:
- Ubuntu Server LTS (22.04 or 24.04) is recommended.
- Update all packages (
sudo apt update && sudo apt upgrade -y).
- Configure system parameters:
- Install OpenJDK (version 17+).
- Increase
vm.max_map_countto 262144 (/etc/sysctl.conf). - Disable swap (
sudo swapoff -a, comment out in/etc/fstab). - Configure
nofileandmemlocklimits for theelasticsearchuser (/etc/security/limits.conf).
- Configure firewall (UFW):
- Allow SSH (22/tcp).
- Allow Kibana (5601/tcp), Elasticsearch (9200/tcp), Beats/Logstash (5044/tcp) ports only from trusted IP addresses.
Phase 3: ELK Stack Installation and Configuration
- Install Elasticsearch:
- Add the Elastic repository.
- Install the
elasticsearchpackage.
- Configure Elasticsearch:
- Edit
/etc/elasticsearch/elasticsearch.yml(network.host,discovery.type: single-node). - Optimize JVM Heap: Set
-Xmsand-Xmx(50% RAM, not more than 30.5 GB) in/etc/elasticsearch/jvm.options. - Start Elasticsearch, save generated passwords and tokens.
- Generate passwords for system users (
kibana_system,logstash_system,filebeat_writer).
- Edit
- Install Kibana:
- Install the
kibanapackage.
- Install the
- Configure Kibana:
- Edit
/etc/kibana/kibana.yml(server.host,elasticsearch.hosts,elasticsearch.username/password). - Start Kibana, complete the registration process with Elasticsearch.
- Edit
- Configure Nginx/Caddy as a reverse proxy for Kibana (recommended):
- Install Nginx/Caddy.
- Configure SSL/TLS for your domain using Let's Encrypt.
- Configure proxying requests from port 80/443 to Kibana port 5601.
- Install Logstash (optional, if complex processing is needed):
- Install the
logstashpackage. - Optimize JVM Heap: Set
-Xmsand-Xmx(1-2 GB) in/etc/logstash/jvm.options. - Create a configuration file (
/etc/logstash/conf.d/*.conf) with inputs, filters, outputs. - Configure SSL/TLS and authentication for Logstash.
- Start Logstash.
- Install the
Phase 4: Log Collection and Management
- Install Filebeat (on source servers):
- Install the
filebeatpackage on each server from which logs are collected.
- Install the
- Configure Filebeat:
- Edit
/etc/filebeat/filebeat.yml(filebeat.inputs,output.elasticsearchoroutput.logstash). - Specify credentials for accessing Elasticsearch/Logstash.
- Configure SSL/TLS for Filebeat.
- Start Filebeat.
- Edit
- Configure Index Lifecycle Management (ILM) in Kibana:
- Create ILM policies for automatic index management (hot/warm/cold/delete phases).
- Ensure Filebeat/Logstash use Data Streams linked to these policies.
- Import dashboards and visualizations:
- Use pre-built dashboards from Elastic (via
filebeat setupor Kibana UI). - Create your own dashboards for monitoring your applications.
- Use pre-built dashboards from Elastic (via
Phase 5: Monitoring and Maintenance
- Enable Stack Monitoring in Kibana:
- Regularly monitor the health of Elasticsearch, Kibana, Logstash, and Beats.
- Configure alerts:
- Create alerts in Kibana (Stack Monitoring Alerts) for critical events (disk full, high CPU load, JVM errors).
- Regularly update the ELK Stack:
- Keep an eye on new versions and security patches.
- Plan updates during off-peak hours.
- Create a backup strategy:
- Configure regular Elasticsearch snapshot creation to cloud storage (S3-compatible).
By following this checklist, you can build a reliable and optimized centralized logging system based on the ELK Stack, even using limited VPS resources.
Cost Calculation / Economics of ELK on VPS (Relevant for 2026)
One of the key factors when choosing and deploying the ELK Stack on a VPS is cost. In 2026, VPS prices remain competitive, but the "free" open-source ELK still requires significant investment in infrastructure and engineer time. Understanding the full cost picture, including hidden expenses, is critical for SaaS project founders and CTOs.
Main Cost Components
- VPS Infrastructure Cost:
- RAM: The most expensive resource for Elasticsearch. More RAM means faster operation.
- CPU: Important for indexing and query processing.
- NVMe SSD: Absolutely essential for I/O performance.
- Traffic: Can be significant if you have many log sources or active Kibana users.
- Engineer Time (the biggest hidden cost):
- Deployment and initial configuration.
- Performance optimization and troubleshooting.
- Regular maintenance, updates, and monitoring.
- Configuring ILM, dashboards, alerts.
- Backup and Snapshot Storage:
- Cost of cloud storage (S3-compatible) for Elasticsearch snapshots.
- Additional Tools and Services:
- DNS services, SSL certificates (though Let's Encrypt are free).
- Alerting systems (e.g., PagerDuty, if free alternatives are not used).
Example Calculations for Different Scenarios (2026, estimated prices)
Assume the average salary of a DevOps engineer in the CIS region is $3000-5000/month (~$20-30/hour).
Scenario 1: Small startup, 100-500 events/sec, 30 days retention.
- VPS configuration: 1x VPS (16 GB RAM, 4 vCPU, 320 GB NVMe SSD, 1 TB traffic)
- Provider: Hetzner Cloud, Vultr, DigitalOcean.
- Monthly VPS cost: ~$40-60
- Additional expenses:
- Snapshot storage (S3-compatible): ~$5-10/month (for 100-200 GB).
- DNS: ~$0-5/month.
- Engineer time:
- Setup: 10-20 hours (initially) = ~$200-600.
- Maintenance: 2-4 hours/month = ~$40-120/month.
Total monthly cost: ~$85-195 (after initial setup).
Scenario 2: Medium-sized SaaS project, 1000-3000 events/sec, 60 days retention.
- VPS configuration: 1x VPS (32 GB RAM, 8 vCPU, 640 GB NVMe SSD, 2 TB traffic) OR 2x VPS (16 GB RAM, 4 vCPU, 320 GB NVMe SSD) for ES/Logstash separation.
- Provider: Hetzner Cloud, Vultr, DigitalOcean.
- Monthly VPS cost: ~$80-150 (for 1-2 VPS).
- Additional expenses:
- Snapshot storage: ~$10-25/month (for 300-500 GB).
- DNS: ~$0-5/month.
- Engineer time:
- Setup: 20-40 hours (initially) = ~$400-1200.
- Maintenance: 4-8 hours/month = ~$80-240/month.
Total monthly cost: ~$170-420 (after initial setup).
Table with Example Calculations for Different Scenarios (2026)
| Parameter | Small Project (500 EPS, 30 days) | Medium Project (3000 EPS, 60 days) | Large Project (10000 EPS, 90 days) |
|---|---|---|---|
| VPS Configuration (RAM/CPU/SSD) | 16GB/4vCPU/320GB NVMe | 32GB/8vCPU/640GB NVMe | 2x (32GB/8vCPU/640GB NVMe) |
| VPS Cost (monthly) | $40-60 | $80-150 | $160-300 |
| S3 Storage Cost (monthly) | $5-10 | $10-25 | $20-50 |
| Initial Setup (engineer hours * $30) | 15 h = $450 | 30 h = $900 | 60 h = $1800 |
| Monthly Maintenance (engineer hours * $30) | 3 h = $90 | 6 h = $180 | 12 h = $360 |
| TOTAL (first month) | $495-520 + $450 = $945-970 | $100-175 + $900 = $1000-1075 | $180-350 + $1800 = $1980-2150 |
| TOTAL (subsequent months) | $45-70 + $90 = $135-160 | $90-175 + $180 = $270-355 | $180-350 + $360 = $540-710 |
Hidden Costs
- Traffic Overruns: If logs are collected from different data centers or there are many Kibana users, traffic can become a significant cost item.
- Downtime: An unstable logging system means you lose valuable data and time to recover it.
- Scaling: Upgrading to a more powerful VPS or adding new nodes is not always seamless and requires planning.
- Training: The time required for the team to master ELK, its features, and optimization.
How to Optimize Costs
- ELK Resource Optimization:
- JVM Heap: Precise tuning of
-Xms/-Xmxfor Elasticsearch and Logstash. - ILM: Set aggressive ILM policies for automatic deletion of old logs to minimize disk space requirements.
- Beats instead of Logstash: Use lightweight Beats for direct log collection and sending to Elasticsearch, avoiding Logstash if no complex processing is needed.
- Query Optimization: Train the team to write efficient queries in Kibana to avoid overloading Elasticsearch.
- JVM Heap: Precise tuning of
- Efficient VPS Usage:
- Choose a VPS with NVMe SSD, as this significantly boosts performance and allows using less RAM for Elasticsearch (due to faster I/O).
- Consider using a single VPS for all ELK components for small to medium projects to avoid additional costs for separate VPS instances.
- Use Nginx/Caddy for caching Kibana static files, reducing the load on Kibana itself.
- Monitoring and Automation:
- Actively use Stack Monitoring in Kibana to identify bottlenecks and prevent problems.
- Automate routine tasks (updates, backups) using scripts or IaC tools.
- Alternatives:
- For very limited budgets or if only basic log viewing is needed, consider Loki + Grafana. This solution is significantly less resource-intensive on a VPS.
- For very large log volumes and if you are already in the cloud, consider managed services (Elastic Cloud, AWS OpenSearch Service), but be prepared for higher costs.
The economics of ELK on a VPS is a continuous optimization process. Regular analysis of resource consumption and configuration adjustments will help you control costs and get the most out of your logging system.
Use Cases and Examples of ELK Stack
To better understand the practical value of the ELK Stack on a VPS, let's look at several realistic scenarios from the world of DevOps and startups, demonstrating how centralized logging helps solve specific problems.
Case 1: Monitoring and Debugging a Microservice Application on Docker Swarm
Problem Description: A small SaaS startup developed an application consisting of 5-7 microservices deployed in Docker Swarm across three VPS instances. Each microservice generates logs in JSON format. When errors occur, users complain about slow performance, but it's very difficult to determine which microservice is the cause. Logs are scattered across different containers on different hosts, and manual review takes hours.
Solution with ELK Stack on VPS: The team deployed one powerful VPS (16GB RAM, 4vCPU, 320GB NVMe) for the ELK Stack.
- Filebeat: Filebeat was installed on each of the three VPS instances with Docker Swarm. It was configured to collect logs from all Docker containers (using
filebeat.autodiscover.providerswith a Docker processor) and send them directly to Elasticsearch on the central VPS. Filebeat automatically added container metadata (service name, container ID). - Elasticsearch: Elasticsearch was configured on the central VPS with an optimized JVM Heap (8GB) and an ILM policy to store logs for 30 days.
- Kibana: Used to create dashboards.
Specific Solutions and Results:
- Error Detection: A dashboard was created in Kibana that aggregated logs by microservice, showing the number of errors (
level: error) for each. When the number of errors in a specific service increased, the team instantly saw the source of the problem. - Request Tracing: Developers added a unique
request_idto the logs of each request passing through the microservices. In Kibana, it became possible to search by thisrequest_idand see the full path of the request through all services, quickly identifying the point of failure. - Accelerated Debugging: The time to detect and isolate problems was reduced from several hours to 5-15 minutes.
- Performance Optimization: Log analysis showed that one of the microservices was generating too many WARN messages, indicating inefficient database queries. Optimizing this service significantly improved the overall application performance.
- Cost Savings: The total cost of one ELK VPS (~$50/month) turned out to be significantly lower than lost engineer time and customer dissatisfaction.
Case 2: Security Analysis and Anomaly Detection for a Backend API
Problem Description: A backend team developing an API on Node.js encountered suspicious activities: periodic spikes in requests from unusual IP addresses, brute-force authentication attempts. The existing logging system (simple file saving) did not allow for prompt detection and response to these threats.
Solution with ELK Stack on VPS: The team deployed ELK on a VPS (32GB RAM, 8vCPU, 640GB NVMe) for higher load and longer retention.
- Filebeat: Filebeat was installed on the server with the Node.js API to collect Nginx logs (access.log, error.log) and the Node.js application logs themselves (in JSON format).
- Logstash: Used to enrich Nginx logs. Logstash, using Grok filters, parsed log lines, extracted IP addresses, User-Agents, and status codes. Then, using a GeoIP filter, it added information about the geographical location of IP addresses.
- Elasticsearch: Stored the enriched logs.
- Kibana: Used for visualization and alert configuration.
Specific Solutions and Results:
- Brute-force Detection: A dashboard was created showing the number of failed login attempts (
status_code: 401) by IP address. An alert was configured in Kibana (Stack Monitoring -> Alerts) that sent a notification to Slack if there were more than 10 failed login attempts from a single IP address within 5 minutes. - Geographical Analysis: Using GeoIP data, a map was built in Kibana showing the sources of requests. This helped identify anomalous traffic spikes from certain countries that are not the target audience.
- User-Agent Analysis: A User-Agent dashboard helped identify bots and security scanners.
- Improved Security: Based on the identified anomalies, the team was able to promptly block suspicious IP addresses at the firewall or Cloudflare level, significantly enhancing API security.
- Compliance Proof: The ability to quickly find and provide logs upon request from regulators or for internal audits.
Case 3: Performance and Error Monitoring in a Monolithic PHP Application
Problem Description: A SaaS project founder, operating an old monolithic PHP application, faces "floating" performance issues and periodic errors that are difficult to reproduce. The application runs on a single VPS, with PHP and Apache logs written to files.
Solution with ELK Stack on VPS: ELK was deployed on the same VPS where the PHP application runs (16GB RAM, 4vCPU, 320GB NVMe) to avoid network latency and additional costs.
- Filebeat: Configured to collect Apache logs (access_log, error_log) and PHP-FPM logs, as well as system logs.
- Logstash: Used for parsing PHP logs (which are often multi-line and unstructured) and normalizing them into JSON. Logstash also enriched logs with request execution time information.
- Elasticsearch: Stored all processed logs.
- Kibana: Used for creating dashboards and alerts.
Specific Solutions and Results:
- Slow Query Detection: PHP logs recorded request execution time. Logstash extracted this value. A dashboard was created in Kibana showing the top-N slowest application requests. This helped identify bottlenecks in the code and database queries.
- Error Monitoring: A dashboard was created aggregating PHP errors by type and file. New or frequent errors were instantly visible. An alert was configured in Telegram for critical errors.
- Traffic Analysis: Dashboards based on Apache access_log allowed tracking traffic peaks, most popular pages, and request sources, helping to plan scaling or optimization.
- Proactive Problem Resolution: The team could now react to problems before they affected a large number of users, based on data rather than complaints.
- Improved Code Quality: Developers received clear metrics and logs for testing and optimizing their code.
These cases demonstrate that the ELK Stack on a VPS, with proper configuration and optimization, is a powerful and affordable tool for solving a wide range of monitoring, debugging, and security tasks for various types of projects.
Tools and Resources for Working with ELK
Effective work with the ELK Stack requires not only an understanding of its components but also the use of auxiliary tools and constant reference to up-to-date resources. In 2026, the ecosystem around Elastic continues to actively develop, offering many utilities and knowledge sources.
1. Utilities for Operation and Diagnostics
curl/wget: Basic utilities for interacting with the Elasticsearch RESTful API. Indispensable for checking cluster status, sending simple queries, or verifying security.curl -u elastic:YOUR_PASSWORD -k "https://localhost:9200/_cat/health?v" curl -u elastic:YOUR_PASSWORD -k -XGET "https://localhost:9200/_cluster/stats?pretty"- Kibana Dev Tools: A built-in Kibana interface for sending queries to Elasticsearch. It allows convenient testing of search queries, managing indices, creating ILM policies, and checking cluster status. This is your primary tool for administration via the UI.
htop/atop/glances: Tools for monitoring system resources (CPU, RAM, disk I/O, processes) on a VPS. Help identify bottlenecks in ELK's operation.sudo apt install htop glances -y htop glancesiostat/vmstat: Utilities for detailed analysis of disk activity and memory usage. Critically important for diagnosing I/O problems, which often occur with Elasticsearch.iostat -x 1 10 # 10 reports with a 1-second interval vmstat 1 10 # 10 reports with a 1-second intervaltcpdump/wireshark: For analyzing network traffic. Useful for debugging connectivity issues between ELK components or between Beats and Logstash/Elasticsearch.sudo tcpdump -i eth0 port 5044journalctl/tail: For viewing system logs and ELK component logs.sudo journalctl -u elasticsearch -f sudo tail -f /var/log/elasticsearch/elasticsearch.log- Elasticsearch Head (browser extension/application): Allows visual management of an Elasticsearch cluster, viewing shards, indices, and performing basic operations. Although Kibana Dev Tools is more powerful, Head can be useful for a quick overview.
jq: A utility for parsing JSON from the command line. Very useful when working with JSON responses from the Elasticsearch API.curl -u elastic:YOUR_PASSWORD -k "https://localhost:9200/_cluster/health?pretty" | jq .status
2. Monitoring and Testing
- Kibana Stack Monitoring: A built-in tool for monitoring the health of the entire ELK Stack. Shows CPU, RAM, I/O, JVM Heap metrics, query count, shard status, and much more. Highly recommended for continuous performance and health tracking.
- Metricbeat: Install it on the ELK VPS to collect system metrics and ELK Stack metrics themselves and send them to Elasticsearch. This will allow you to create your own monitoring dashboards if the built-in Stack Monitoring is insufficient.
- Prometheus + Grafana: If you already have a monitoring infrastructure on Prometheus, you can use Exporters for Elasticsearch and Logstash to collect their metrics and visualize them in Grafana.
- Apache JMeter / k6: For load testing the ELK Stack. Allows simulating a large log stream or intensive search queries to check the performance and stability of your configuration.
3. Useful Links and Documentation (2026)
- Official Elastic Documentation: elastic.co/guide/en/elastic-stack/current/index.html
- Always refer to the official documentation for your ELK version. It is the most complete and up-to-date.
- Elastic Blog: elastic.co/blog
- Contains many articles on new features, best practices, optimization, and real-world use cases.
- Elastic Community Forums: discuss.elastic.co/
- An active community where you can ask questions, find solutions to common problems, and share experiences.
- YouTube channels and learning platforms:
- Official Elastic channel on YouTube.
- Udemy, Coursera, Pluralsight: ELK Stack courses, often updated for new versions.
- Awesome Elasticsearch: github.com/dzharii/awesome-elasticsearch
- A curated list of useful resources, tools, plugins, and articles on Elasticsearch.
- Community articles and guides:
- DigitalOcean Community Tutorials, Logz.io Blog, Medium articles from DevOps engineers. Look for fresh materials published in 2024-2026.
Using these tools and resources will significantly simplify the process of deploying, configuring, monitoring, and troubleshooting the ELK Stack on your VPS, allowing you to stay abreast of the latest trends and best practices.
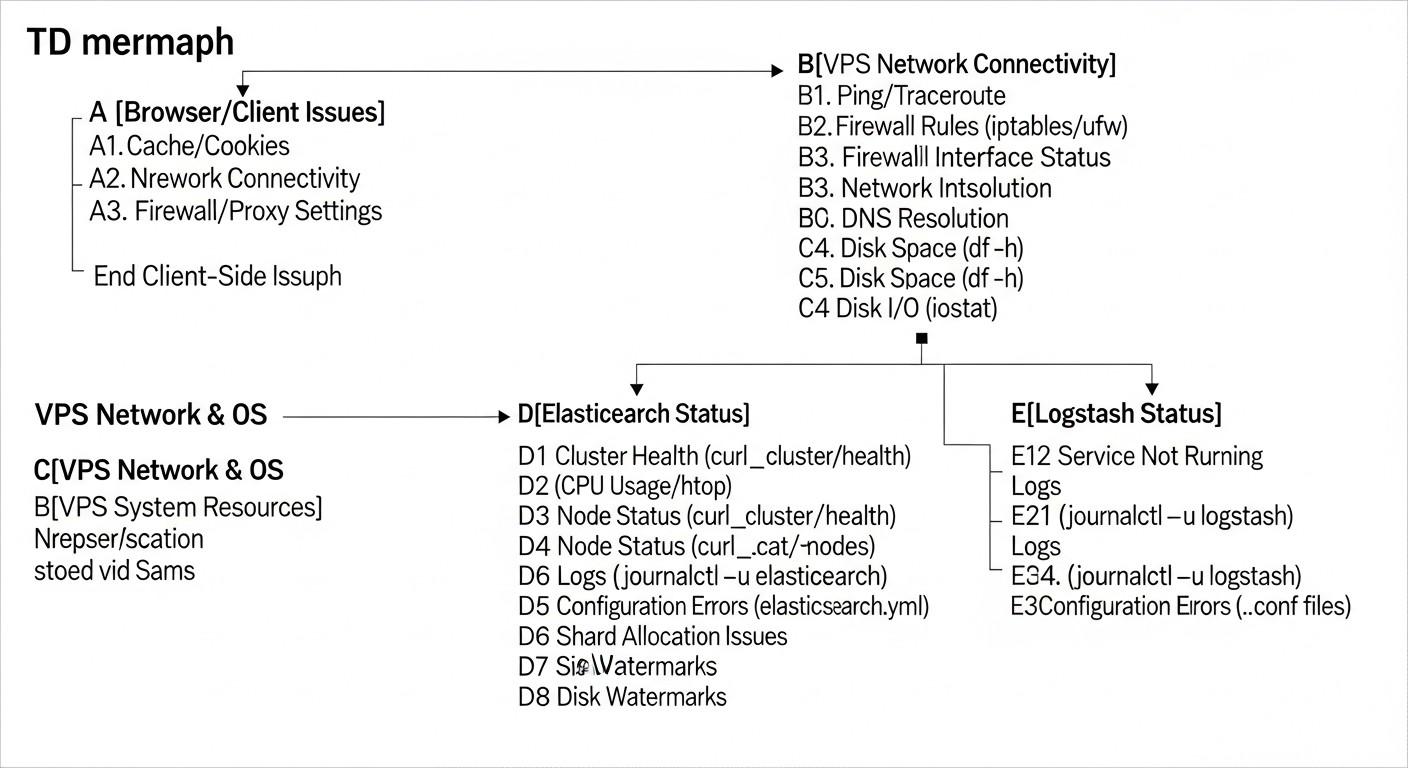
Troubleshooting: Solving ELK Problems
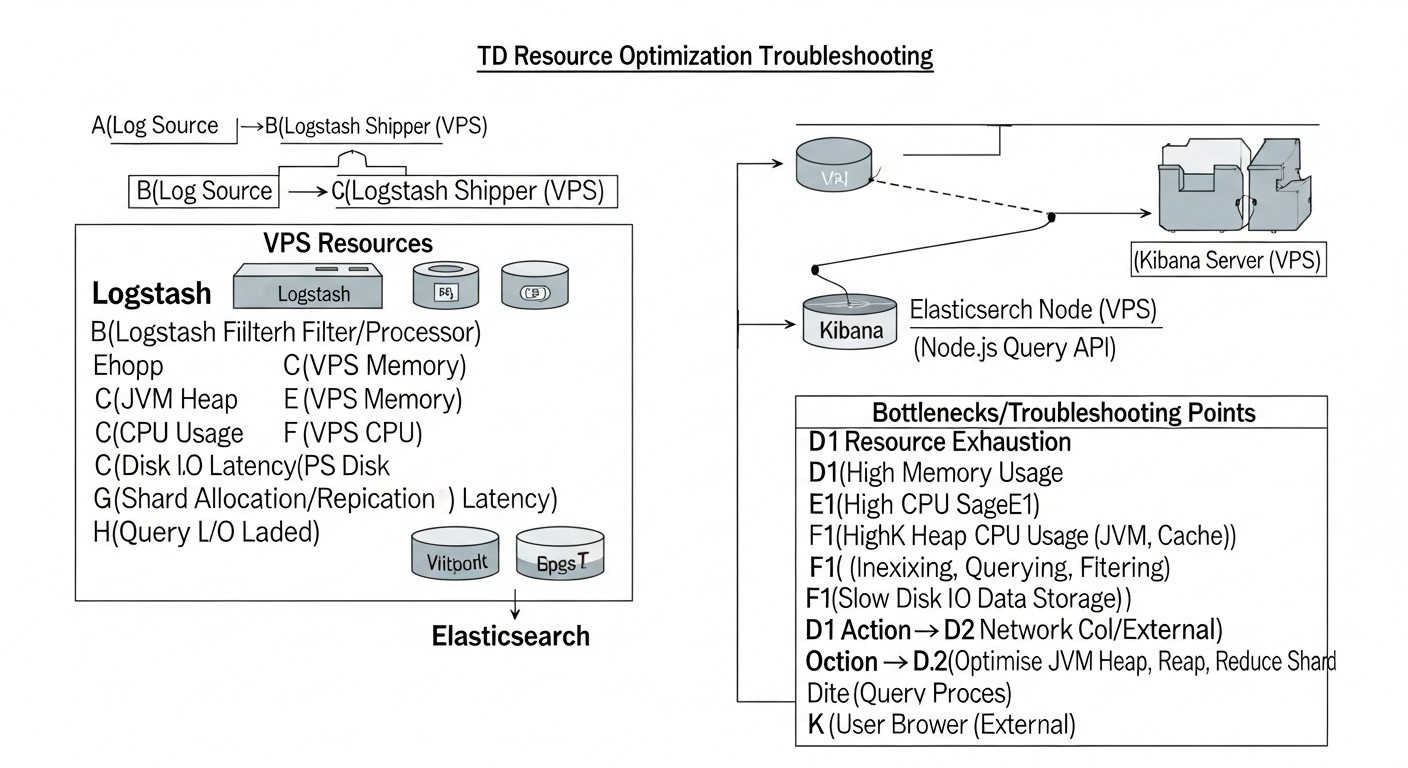
Even with the most careful configuration, problems with the ELK Stack on a VPS are inevitable. They can range from resource shortages to configuration errors and network issues. The ability to quickly diagnose and resolve them is a key skill for anyone working with ELK. Here are typical problems and their solutions.
1. Elasticsearch Fails to Start or Runs Unstably
Typical problems:
- OutOfMemoryError (OOM): Insufficient memory for JVM.
- Disk Full / Low Disk Space: Disk is full or nearly full.
vm.max_map_counttoo low: Elasticsearch cannot allocate necessary system resources.- File descriptor issues:
nofilelimit is too low. - Configuration error in
elasticsearch.yml: Syntax errors or incorrect parameters. discovery.typenot configured for single-node: Elasticsearch tries to find other cluster nodes and cannot start.
Diagnostic commands:
sudo systemctl status elasticsearch.service # Check service status
sudo journalctl -u elasticsearch.service -f # View service logs in real-time
sudo tail -f /var/log/elasticsearch/elasticsearch.log # Main Elasticsearch log
df -h # Check free disk space
free -h # Check RAM usage
sysctl vm.max_map_count # Check vm.max_map_count value
ulimit -n # Check file descriptor limit for the current user
Solutions:
- OOM: Reduce
-Xms/-Xmxinjvm.optionsto 50% of RAM, but no more than 30.5 GB. Disable swap. - Disk Full: Delete old indices (manually or via ILM). Increase disk space.
vm.max_map_count: Setvm.max_map_count=262144in/etc/sysctl.confand apply withsudo sysctl -p.nofile: Increasenofileto 65536 for theelasticsearchuser in/etc/security/limits.conf.- Configuration: Carefully check
elasticsearch.ymlfor typos. Usediscovery.type: single-nodefor a single VPS.
2. Kibana Fails to Connect to Elasticsearch
Typical problems:
- Elasticsearch unavailable: Elasticsearch is not running, or its port is blocked by the firewall.
- Incorrect
elasticsearch.hosts: Incorrect address or port for Elasticsearch specified inkibana.yml. - SSL/TLS issues: Incorrect certificates, CA, or protocol mismatch (HTTP/HTTPS).
- Authentication error: Incorrect username/password for the
kibana_systemuser. - Enrollment token issues: If Kibana requests a token and you haven't provided it.
Diagnostic commands:
sudo systemctl status kibana.service
sudo journalctl -u kibana.service -f
curl -u elastic:YOUR_PASSWORD -k "https://localhost:9200" # Check ES availability
Solutions:
- ES Availability: Ensure Elasticsearch is running and port 9200 is open for Kibana (
network.hostinelasticsearch.yml). elasticsearch.hosts: Verify that the address and port inkibana.ymlare correct and match the protocol (https://localhost:9200).- SSL/TLS: Ensure certificates are correct and Kibana trusts the Elasticsearch CA. For a quick test, you can temporarily disable
ssl.verification_mode: none(not recommended for production). - Authentication: Check that
elasticsearch.usernameandelasticsearch.passwordinkibana.ymlare correct. Generate a new password forkibana_systemif in doubt. - Enrollment Token: If Kibana requires a token, generate it in Elasticsearch (
elasticsearch-create-enrollment-token -s kibana) and enter it in the UI.
3. Logs Are Not Ingested into Elasticsearch / Kibana
Typical problems:
- Filebeat/Logstash not running: Service is not active.
- Filebeat/Logstash configuration error: Incorrect log paths, wrong output, syntax errors.
- Network issues: Firewall blocking port 5044 (for Beats/Logstash) or 9200 (for direct ES connection).
- SSL/TLS issues: Incorrect certificates, CA, or protocol mismatch between Beats/Logstash and ES.
- Authentication error: Incorrect username/password for the Filebeat/Logstash user.
- Missing index templates/data streams: Elasticsearch doesn't know how to process incoming data.
Diagnostic commands:
sudo systemctl status filebeat.service # Or logstash.service
sudo journalctl -u filebeat.service -f # Or logstash.service
sudo tail -f /var/log/filebeat/filebeat.log # Or logstash.log
ping your_elk_vps_ip # Check network accessibility
telnet your_elk_vps_ip 5044 # Check port accessibility
Solutions:
- Service Status: Ensure Filebeat/Logstash are running and not showing errors in their logs.
- Configuration: Check
filebeat.ymlorlogstash.conffor typos. Ensure log paths are correct and output is configured properly. - Network Issues: Open ports in the firewall. Check
network.hostin Logstash configuration. - SSL/TLS: Verify that certificates and CA are correct and trusted.
- Authentication: Ensure the username/password for the Filebeat/Logstash user in the configuration are correct.
- Templates: Use
filebeat setupto load default templates or ensure your output is configured to use Data Streams.
4. Slow Search or Visualization in Kibana
Typical problems:
- Insufficient Elasticsearch resources: High CPU or RAM usage.
- Too many shards: Especially on a single node, this leads to overhead.
- Complex or unoptimized queries: Queries scanning large volumes of data.
- Lack of ILM: Too much old, but irrelevant data in "hot" indices.
- Disk I/O issues: Slow NVMe SSD or its overload.
Diagnostic commands:
curl -u elastic:YOUR_PASSWORD -k "https://localhost:9200/_cat/indices?v" # View indices and shards
curl -u elastic:YOUR_PASSWORD -k "https://localhost:9200/_nodes/stats?pretty" # Node statistics
Solutions:
- Resources: Increase VPS RAM or CPU, if budget and capabilities allow. Optimize JVM Heap.
- Shards: For a single node, try to keep the number of shards reasonable (e.g., 1-3 shards per 1GB RAM). Use 1 Primary Shard and 0 Replicas for a single node.
- Queries: Optimize queries in Kibana. Use time filters, exclude unnecessary fields.
- ILM: Implement ILM policies for automatic movement and deletion of old data.
- Disk I/O: Ensure NVMe SSD is used. Monitor
iostatto confirm the disk is not a bottleneck.
When to Contact Support?
Contact Elastic support (if you have a paid subscription) or the Elastic community (forums, GitHub Issues) if:
- You have tried all standard diagnostic and resolution methods, but the problem persists.
- You encountered a bug that you believe is an error in the Elastic software itself.
- The problem involves data loss or severe performance degradation threatening your application's functionality.
- You need expert assistance with complex scaling or architectural issues.
Always provide as much information as possible: service logs, configuration files, results of diagnostic commands, ELK Stack version, and a description of steps to reproduce the problem.
Frequently Asked Questions (FAQ)
What is the ELK Stack and why is it so popular in DevOps?
The ELK Stack is a collection of three open-source projects (Elasticsearch, Logstash, Kibana) used for centralized collection, processing, storage, and visualization of logs and metrics. It is popular in DevOps due to its flexibility, scalability, and powerful analytical capabilities, which allow teams to quickly debug problems, monitor performance, and analyze application behavior in distributed systems. In 2026, despite the emergence of competitors, ELK remains a standard due to its maturity and extensive community.
Can the ELK Stack be run on a single VPS? What are the minimum requirements?
Yes, it can, and this is a common practice for small to medium projects. The minimum requirements for a single VPS in 2026 are: 8 GB RAM, 4 vCPU, and 200 GB NVMe SSD. For comfortable operation and processing up to 1000-2000 events per second, 16 GB RAM, 4-8 vCPU, and 320+ GB NVMe SSD are recommended. Always use NVMe SSD due to Elasticsearch's intensive I/O operations.
How to optimize Elasticsearch memory consumption on a VPS?
The main way is proper JVM Heap Size configuration. Set -Xms and -Xmx in /etc/elasticsearch/jvm.options to the same value, approximately 50% of the available physical RAM on the VPS, but no more than 30.5 GB (due to compressed pointers). Also, ensure swap is disabled, as its use catastrophically slows down Elasticsearch.
What is the difference between Filebeat and Logstash? Which is better to use on a VPS?
Filebeat is a lightweight log shipper that efficiently forwards logs from sources to Logstash or Elasticsearch. It consumes minimal resources. Logstash is a powerful ETL pipeline for complex data processing, parsing, and enrichment. On a VPS, it is recommended to use Filebeat for log collection and send them directly to Elasticsearch if complex processing is not required. Use Logstash only for tasks where complex filters (Grok, GeoIP, etc.) are necessary, as it is significantly more resource-intensive.
How to secure the ELK Stack on a VPS?
Enable X-Pack Security (it's enabled by default in Elasticsearch 8.x) for authentication and authorization. Use strong, unique passwords for all system and user accounts. Configure SSL/TLS for all traffic between ELK components and between clients and Kibana/Elasticsearch. Be sure to use a firewall (e.g., UFW) to restrict access to ports 9200 (Elasticsearch), 5601 (Kibana), and 5044 (Beats/Logstash) only from trusted IP addresses or via a reverse proxy with authentication.
What is ILM and why is it important for ELK on a VPS?
ILM (Index Lifecycle Management) is an Elasticsearch feature that automates the management of the index lifecycle. It allows defining policies for automatically moving indices between phases (hot, warm, cold) and deleting them. For a VPS, this is critically important as disk space is limited. ILM helps automatically free up space by deleting old logs and maintain performance by moving less relevant data to slower but cheaper storage (although on a single VPS, this simply means deletion).
How to monitor the health of the ELK Stack on a VPS?
Use the built-in Kibana Stack Monitoring. It provides detailed information about the health of each ELK component, resource utilization, indexing and search performance. Also, install Metricbeat on the ELK VPS to collect system metrics and ELK's own metrics. Configure alerts in Kibana for critical events such as disk full, high CPU load, or JVM errors.
Should Docker be used for deploying ELK on a VPS?
Yes, using Docker (or Docker Compose) simplifies the deployment, dependency management, and updating of the ELK Stack. It allows easy portability of configurations between environments. However, it's important to correctly configure volumes for persistent storage of Elasticsearch and Logstash data, and ensure that Docker containers have access to sufficient system resources and correctly configured memory/CPU limits.
What alternatives to the ELK Stack exist for resource-constrained VPS?
For VPS instances with very limited resources or for teams needing a lighter stack, Loki + Grafana is an excellent alternative. Loki indexes only log labels, not their content, which makes it significantly less demanding on RAM and CPU. Logs are stored in object storage (e.g., S3-compatible). This is an ideal option if you already use Grafana for metric monitoring and need fast log search rather than deep full-text analytics.
How often should the ELK Stack be updated?
It is recommended to keep an eye on new stable versions and apply updates regularly, especially security patches. Typically, it is advised to update every 3-6 months or when minor versions are released that contain important fixes and performance improvements. Always read the Release Notes and test the update in a non-production environment before updating.
Conclusion
Centralized logging, whether in 2026 or any other year, remains a cornerstone of effective DevOps practices. The ability to quickly aggregate, analyze, and visualize data streams from your distributed infrastructure provides unprecedented transparency and allows for prompt incident response, performance optimization, and enhanced security. The ELK Stack, despite its resource intensity, continues to be one of the most powerful and flexible tools for these purposes, especially when it comes to deep analytics and full-text search.
Deploying ELK on a VPS, as we have found, is not only possible but also economically justified for many startups and medium-sized projects, provided careful resource optimization. The key to success lies in understanding the requirements of each ELK component, proper JVM Heap configuration, efficient use of Beats, implementing Index Lifecycle Management policies, and, of course, continuous monitoring and maintenance of the system.
We have covered how to choose the right VPS, how to step-by-step install and configure ELK components, how to avoid common errors, optimize costs, and resolve emerging problems. The provided use cases demonstrate real-world scenarios where ELK on a VPS helps teams make informed decisions and significantly improve operational efficiency.
It's important to remember that "free" open-source does not mean "cost-free." Investments in engineer time and competent infrastructure planning are a significant part of the total cost of ownership. However, these investments pay off many times over by reducing downtime, accelerating debugging, and improving overall product quality.
Final Recommendations:
- Plan ahead: Estimate the expected log volume and storage requirements to choose the optimal VPS configuration.
- Prioritize NVMe SSD and RAM: These are the most critical resources for Elasticsearch performance.
- Optimize JVM Heap: This is your best friend in the fight for performance on limited resources.
- Use Beats: Maximize the use of lightweight Beats for log collection, leaving Logstash only for complex transformations.
- Implement ILM: Automate index lifecycle management to control disk space.
- Don't forget security: SSL/TLS, authentication, and a firewall are not options, but mandatory requirements.
- Monitoring is everything: Actively use Kibana Stack Monitoring and configure alerts for proactive response.
- Consider alternatives: If your logging needs are minimal or your budget is extremely limited, Loki + Grafana might be a more suitable choice.
Next Steps for the Reader:
- Start small: Deploy a test ELK Stack on a small VPS to master basic concepts and configurations.
- Experiment with data: Send your application logs to ELK, try parsing them, and creating simple dashboards.
- Dive into the documentation: Official Elastic documentation is your primary source of knowledge.
- Join the community: Interact with other DevOps engineers, share experiences, and ask questions on forums.
Ultimately, the ELK Stack on a VPS is a powerful tool in the hands of a competent DevOps engineer. It gives you control, transparency, and confidence in your infrastructure, allowing you to focus on creating value for your users, rather than searching for needles in a haystack of logs.