
SRE Practices for Startups and Small SaaS Teams on VPS/Dedicated: From SLO to Post-Mortem
TL;DR
- Implementing SRE practices is critical for the survival and scaling of startups on VPS/Dedicated, ensuring stability and predictability of operations.
- Start by defining key metrics (SLI) and realistic goals (SLO) for your critical services, without striving for ideal "nines."
- Effective monitoring and alerting are the foundation of SRE; use open-source solutions like Prometheus/Grafana for cost savings and control.
- Develop simple but effective incident response processes and conduct "blameless" Post-Mortems for continuous learning.
- Automate routine tasks (deployment, updates, backups) to reduce "toil" and minimize human error.
- SRE does not require large budgets; focusing on practicality, an iterative approach, and using available tools will yield significant results.
- Investment in SRE pays off by reducing downtime, improving reputation, decreasing team stress, and accelerating development.
Introduction
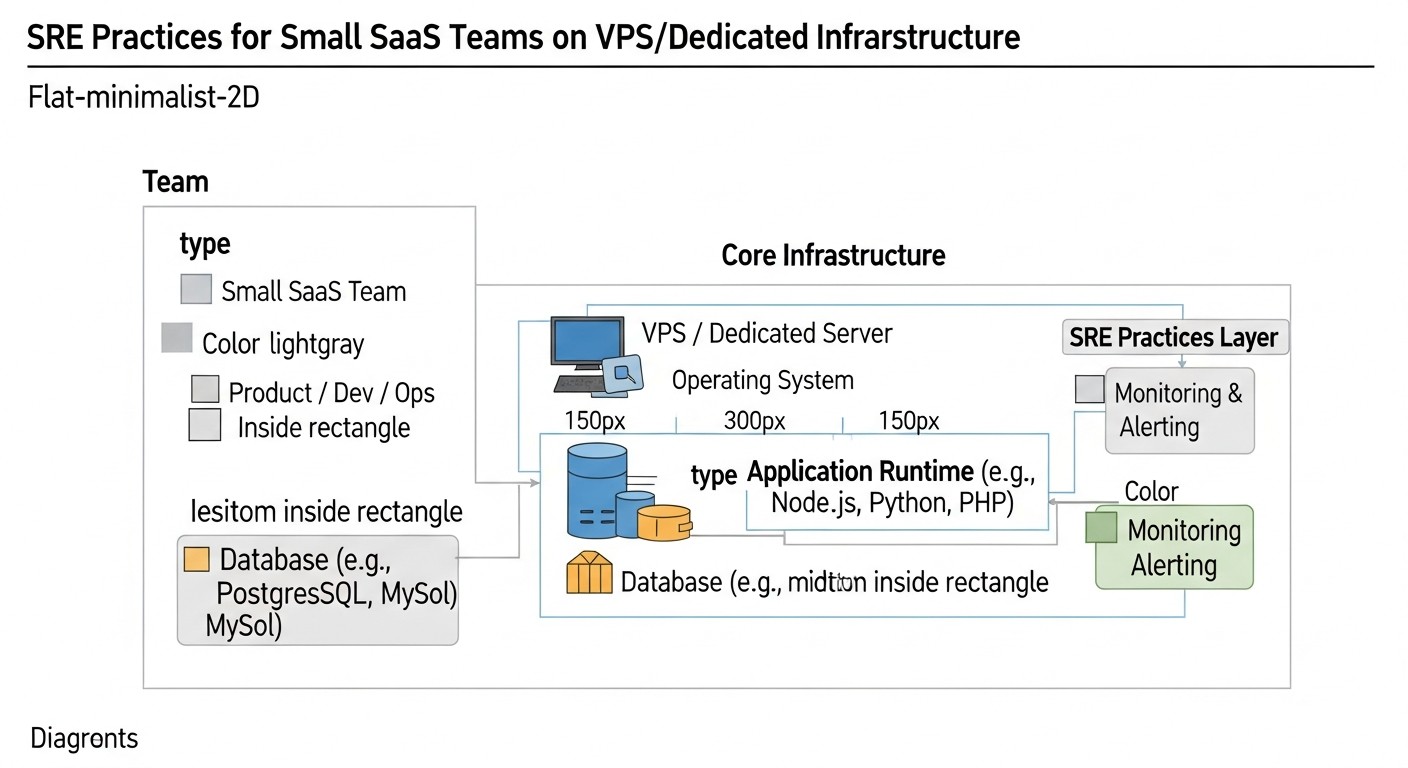
In the rapidly changing technology landscape of 2026, where user expectations for service stability and speed have reached unprecedented levels, and competition among startups and SaaS projects continues to intensify, the ability to maintain high availability and performance is no longer just an advantage, but a vital necessity. For many young companies and small teams operating on VPS or dedicated servers, implementing complex methodologies at the Google level might seem like an unattainable dream. However, this is precisely where adapted SRE (Site Reliability Engineering) practices come to the rescue.
This article is designed to dispel the myth that SRE is exclusively for tech giants. We will demonstrate how SRE principles, such as defining SLI/SLO, managing error budgets, effective monitoring, prompt incident response, and conducting Post-Mortems, can be successfully applied even with limited resources and small teams. We will focus on practical aspects applicable to VPS/Dedicated infrastructure, where every cent and every minute matters.
Why is this topic particularly important now, in 2026? On one hand, the cost of cloud resources continues to rise, making VPS and dedicated servers more attractive in terms of capital expenditure for many startups. On the other hand, the complexity of modern applications does not decrease, and user expectations for service quality only increase. This creates a dilemma: how to ensure reliability and scalability on "bare metal" without armies of engineers and unlimited budgets? SRE offers an answer, focusing on automation, measurement, and a culture of continuous improvement.
What problems does this article solve? We will help you:
- Overcome chaotic problem-solving and transition to proactive reliability management.
- Determine what is truly important for your business in terms of availability and performance.
- Reduce downtime and minimize its impact on the business.
- Reduce stress and burnout within the team through automation and clear processes.
- Create a culture of learning from mistakes, not blaming.
- Optimize infrastructure and tool costs by choosing the most effective solutions for your environment.
Who is this guide written for? It will be an invaluable resource for:
- DevOps engineers striving to systematize their work and implement best practices.
- Backend developers (in Python, Node.js, Go, PHP) who want to better understand the operational aspects of their applications and contribute to their reliability.
- SaaS project founders who need to ensure the stability of their product to retain customers and grow.
- System administrators looking for ways to improve the efficiency of server and application management.
- Technical directors of startups tasked with building reliable and scalable infrastructure with limited resources.
Prepare to dive into the world of practical SRE, where every piece of advice is proven by real-world experience and aimed at achieving tangible results.
Core SRE Criteria and Factors for Small Teams
At the heart of any effective SRE strategy is an understanding of key metrics and principles. For startups and small SaaS teams on VPS/Dedicated, it's crucial not just to copy the approaches of giants, but to adapt them to their realities, focusing on maximum return with minimal cost. Let's look at the main criteria and factors that will serve as your guidelines.
1. Service Level Indicators (SLI)
SLI are quantitative metrics that show how well your service is performing. For small teams, choosing the right SLI is critical, as there will be few of them, and they must be as informative as possible. Why they are important: SLI serve as the basis for measuring performance and reliability. How to evaluate: They must be measurable, understandable, and directly related to the user experience.
- Latency: The time it takes for the server to respond to a user request. For web applications, this could be page load time or API response time. Example: 95% of API requests should complete in less than 300 ms.
- Error Rate: The percentage of requests that resulted in an error (e.g., HTTP 5xx). This directly indicates problems in the application or infrastructure. Example: less than 0.1% of requests to the main service should return 5xx errors.
- Availability: The percentage of time the service is accessible and operational. Often measured as (total time - downtime) / total time. Example: 99.9% availability of the main web service.
- Throughput: The number of requests processed per unit of time. Important for assessing scalability and performance under load. Example: processing at least 1000 requests/sec at peak load.
Our experience shows that you should start with 2-3 of the most critical SLI for your primary user scenario. For example, for a SaaS platform, this might be API availability and authentication response latency.
2. Service Level Objectives (SLO)
SLO are specific target values for your SLI, expressed as percentages or absolute numbers over a defined period. Why they are important: SLO translate abstract metrics into concrete, measurable goals around which all reliability efforts are built. They help the team understand when a service is "good enough." How to evaluate: SLO should be realistic and achievable, not idealistic. Overly ambitious SLO will lead to burnout, while too low ones will lead to user dissatisfaction.
- Example SLO for availability: "Main API availability must be at least 99.9% over a calendar month." This means an allowable downtime of approximately 43 minutes per month.
- Example SLO for latency: "The 99th percentile of response latency for critical database queries must be less than 200 ms."
For startups, it's important not to chase "five nines" (99.999%), which require enormous costs. Often 99.5% or 99.9% is more than sufficient, especially in the early stages. Real case: We once encountered a situation where a team set a 99.99% SLO for a new service running on a single VPS. This led to constant stress and overtime until we adjusted it to 99.5%, which proved perfectly acceptable for users and significantly reduced the team's workload.
3. Service Level Agreement (SLA)
SLA is a formal contract between the service provider (you) and the client, which describes the expected level of service and the consequences of its non-fulfillment (e.g., financial compensation). Why they are important: SLA is a legal obligation based on your SLO. How to evaluate: It must be realistic and correspond to your internal capabilities, dictated by your SLO.
For small SaaS teams, an SLA can be part of the terms of service. It's important that the SLA is less stringent than your internal SLO, so you have a "buffer." For example, if your SLO is 99.9%, the SLA might be 99.5%.
4. Error Budgets
An error budget is the allowable amount of "unreliability" or "downtime" over a specific period that you are willing to accept without violating your SLO. If your SLO is 99.9% availability, then 0.1% of the time (approximately 43 minutes per month) is your error budget. Why they are important: Error budgets are a powerful tool for balancing reliability and development speed. If the error budget is exhausted, the team must pause the release of new features and focus on improving reliability. How to evaluate: Track error budget usage daily or weekly. When it approaches zero, it's a call to action.
This helps avoid the eternal dilemma of "features versus stability." Real example: Once, after a series of incidents, our error budget was almost exhausted. We decided to completely halt new feature development for two weeks to focus on refactoring problematic areas, improving monitoring, and automating deployment. This allowed us to stabilize the service and regain user trust.
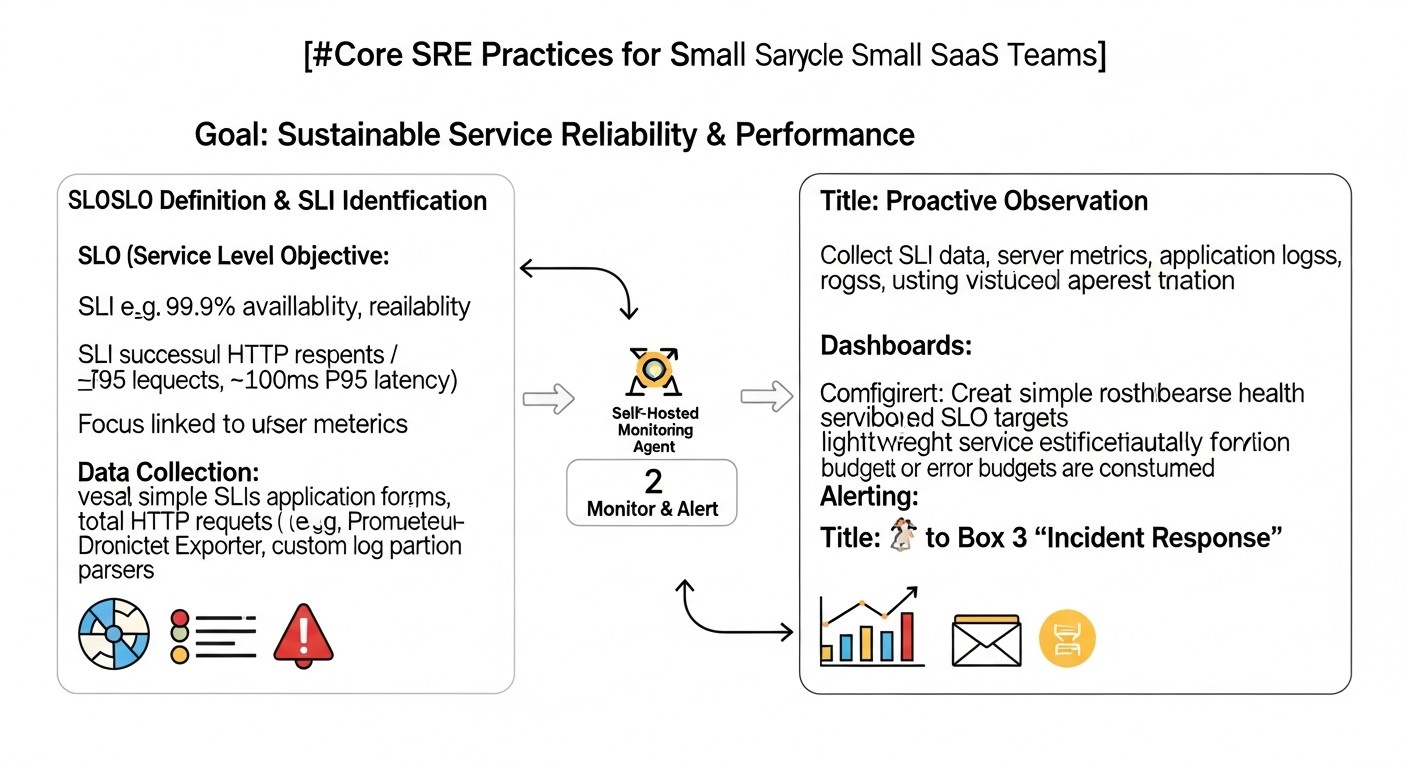
5. Monitoring & Alerting
Monitoring is the collection and analysis of data about your system's state. Alerting is a notification that something has gone wrong or is outside acceptable limits. Why they are important: These are the eyes and ears of your SRE practice. Without them, it's impossible to track SLI, control SLO, and respond to problems. How to evaluate: Monitoring should be comprehensive (infrastructure, application, user experience), and alerts should be actionable, not causing "alert fatigue."
- Infrastructure metrics: CPU, RAM, Disk I/O, Network I/O for VPS.
- Application metrics: Number of requests, response latency, number of errors, connection pool status (DB, cache).
- Logs: Centralized collection and analysis of logs for quick troubleshooting.
- Tracing: For distributed systems, allows tracking a request's path through different components. For VPS, this can be more complex but useful for understanding interactions between your services.
For small teams on VPS, self-hosting Prometheus + Grafana is the gold standard, providing powerful capabilities at minimal cost.
6. Incident Response
Incident Response is the process a team uses to detect, assess, resolve, and document incidents affecting a service. Why they are important: Even with the best SRE practices, incidents are inevitable. An effective response process minimizes Mean Time To Recover (MTTR) and its impact on the business. How to evaluate: Measure MTTR and the number of incidents. The goal is to reduce MTTR and prevent incident recurrence.
Small teams need a clear but simple plan: who is on call, how they are notified, where it's documented, what steps are taken. It's important to have "runbooks" – step-by-step instructions for resolving common problems.
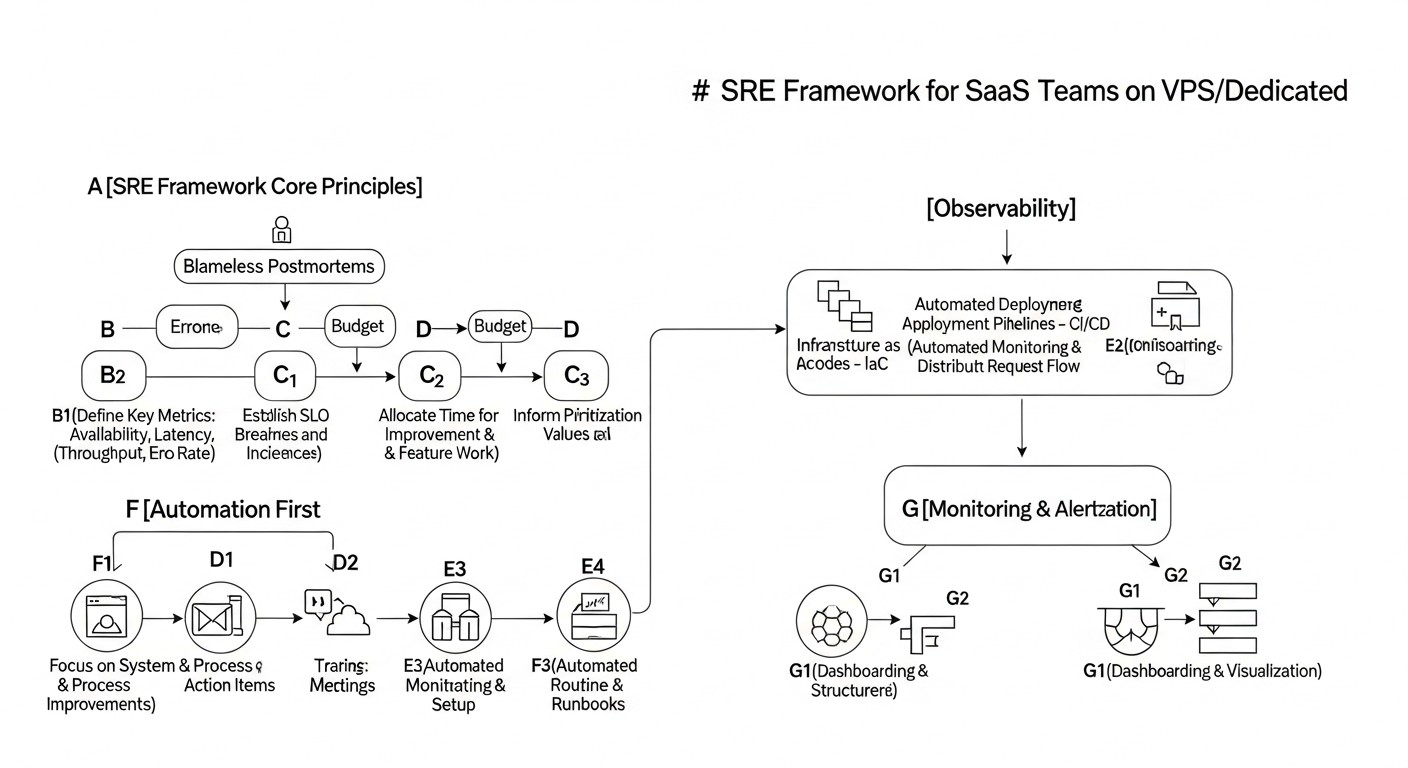
7. Post-Mortem (Blameless)
A Post-Mortem is the process of analyzing an incident after its resolution to learn lessons and prevent its recurrence. "Blameless" means the focus is on systemic problems, not on finding fault. Why they are important: This is a key mechanism for continuous reliability improvement. Without Post-Mortems, the team is doomed to repeat the same mistakes. How to evaluate: The number and quality of identified "action items" (improvement actions), their execution, and their impact on reliability metrics.
For startups, this can be a simple 30-60 minute meeting after each serious incident, discussing: what happened, why, what we did to fix it, what we can do to prevent recurrence. It's important to document the findings.
8. Automation
Automation is the elimination of routine, repetitive tasks (toil) using scripts and tools. Why they are important: Automation reduces human errors, speeds up operations, frees up engineers' time for more valuable work, and increases system predictability. How to evaluate: Number of automated tasks, reduction in "toil," deployment speed, reduction in errors related to manual operations.
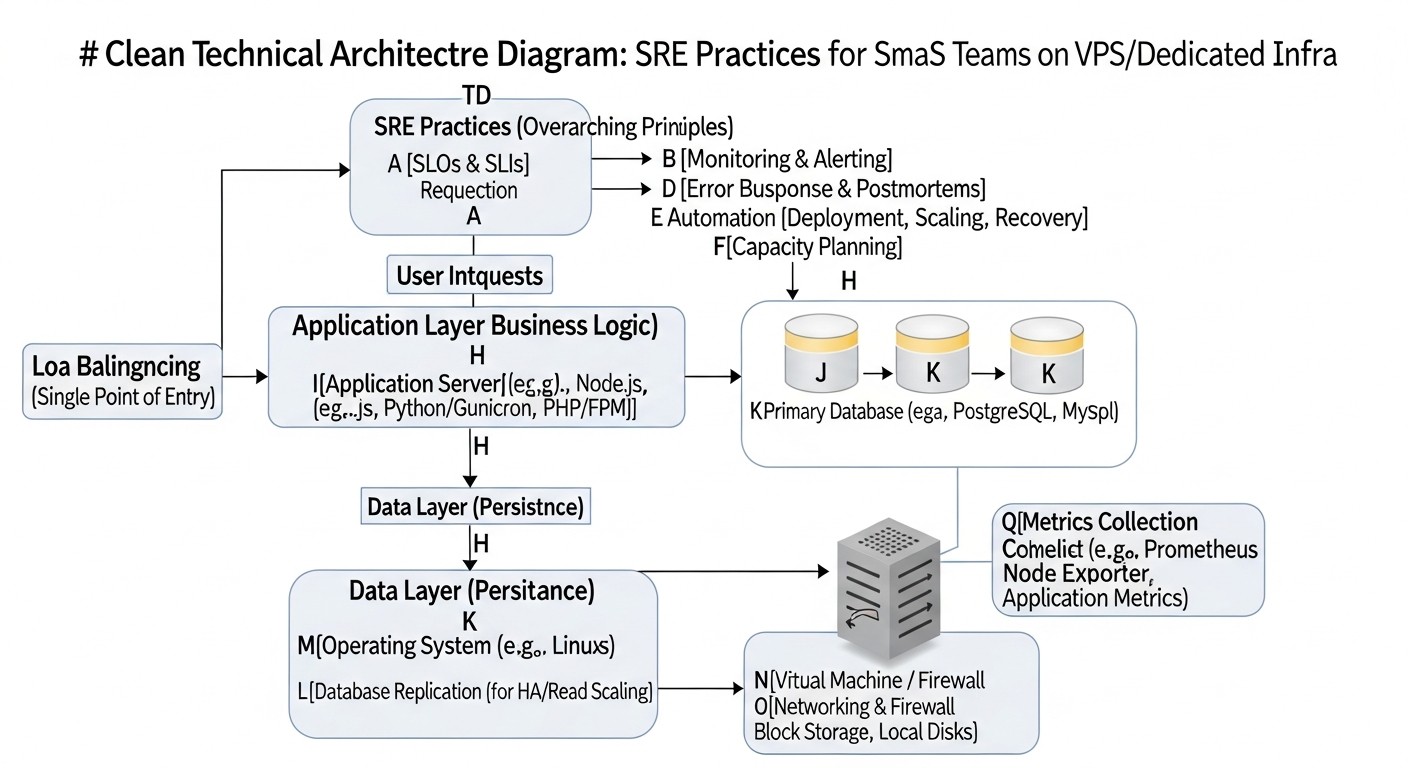
For VPS/Dedicated, this can include automating deployment (CI/CD), backups, OS and dependency updates, scaling (if possible), and server configuration (Infrastructure as Code with Ansible). Even simple bash scripts can have a huge impact.
9. Observability
Observability is the ability to understand the internal state of a system by simply examining the data it generates (metrics, logs, traces). Why they are important: Observability allows you not just to know that something broke, but to understand *why* it happened, without the need for additional debugging or machine access. How to evaluate: Speed of diagnosis and resolution of unknown problems, depth of understanding of system behavior.
For small teams, this can be a challenging task due to limited resources. Start with good metric collection and centralized logging. Tracing can be implemented later, as complexity and resources grow. Loki for logs and Tempo for traces (in conjunction with Grafana) can be good open-source choices.
10. Capacity Planning
Capacity Planning is the process of forecasting future resource needs (CPU, RAM, disk, network) and planning infrastructure accordingly. Why they are important: It helps avoid service degradation due to resource shortages and optimizes costs by purchasing only necessary capacity. How to evaluate: Accuracy of forecasts, absence of resource-related incidents, optimal utilization of current capacity.
On VPS/Dedicated, this usually boils down to monitoring current resource usage and forecasting based on growth trends. If you see that CPU is consistently loaded at 80-90%, it's a signal to upgrade the VPS or optimize the application. For startups, this process is often more reactive than proactive, but continuous monitoring allows for informed scaling decisions.
Comparative Table of SRE Tools
Choosing the right tools is critically important for effective SRE implementation, especially with limited VPS/Dedicated budgets. In 2026, the market offers both mature open-source solutions and commercial SaaS products with plans for small teams. This table will help compare some of them by key parameters.
| Criterion | Prometheus + Grafana | Zabbix | Datadog (Starter/Pro) | New Relic (Standard) | ELK Stack (self-hosted) | Loki + Grafana |
|---|---|---|---|---|---|---|
| Solution Type | Open-source, self-hosted | Open-source, self-hosted | SaaS | SaaS | Open-source, self-hosted | Open-source, self-hosted |
| Key Features | Metrics, alerts, dashboards | Metrics, alerts, dashboards, inventory | APM, infrastructure, logs, synthetics, RUM | APM, infrastructure, logs, synthetics, RUM | Logs, metrics, traces (via APM) | Logs (with metrics and traces via Grafana) |
| Implementation Complexity (for VPS) | Medium (requires configuration) | Medium (requires configuration) | Low (agent installation) | Low (agent installation) | High (many components) | Low-Medium (easier than ELK) |
| Approximate Cost (2026, $/month) | 0 (VPS resources only) | 0 (VPS resources only) | $30-100+ (depends on volume) | $25-75+ (depends on volume) | 0 (VPS resources only) | 0 (VPS resources only) |
| VPS Resource Requirements | Medium | Medium | Low (agent) | Low (agent) | High (especially Elasticsearch) | Low-Medium |
| Scalability | Good (federation) | Good | Excellent (SaaS) | Excellent (SaaS) | Medium-Good (cluster) | Excellent (cloud-native) |
| Ideal for | Small teams, budget projects, flexibility | Traditional SysOps, comprehensive infrastructure monitoring | Quick start, comprehensive APM, ready-made solutions | Quick start, comprehensive APM, ready-made solutions | Deep log analysis, large data volumes | Economical logging, Grafana integration |
| Support | Community, paid vendors | Community, paid vendors | Vendor | Vendor | Community, Elastic Inc. | Community, Grafana Labs |
Comments on the table:
- Prometheus + Grafana: This is the "gold standard" for many startups on VPS. Prometheus collects metrics, Grafana visualizes them. Both tools are very powerful, flexible, and have a huge community. They require some time to learn and configure but pay off with complete freedom and no monthly fees for functionality.
- Zabbix: A more traditional monitoring system, often used by system administrators. Excellent for monitoring servers, network equipment, but can be less flexible for monitoring modern microservice applications compared to Prometheus.
- Datadog / New Relic: These are powerful "all-in-one" commercial platforms. They offer APM (Application Performance Monitoring), infrastructure monitoring, logs, tracing, synthetic monitoring, and much more. Their main advantage is ease of implementation and deep analytics out-of-the-box. However, for startups on VPS, their cost can quickly become significant, especially with growing data volumes. For very small teams, there might be free or very cheap plans, but with limitations.
- ELK Stack: Elasticsearch, Logstash, Kibana – this is a powerful stack for collecting, storing, analyzing, and visualizing logs. It provides deep capabilities for searching and analyzing text data. However, Elasticsearch is very resource-intensive, and deploying it on a single VPS can be complex and resource-heavy. It often requires a separate dedicated server or cluster.
- Loki + Grafana: Loki is a log aggregation system developed by Grafana Labs. It is much less resource-intensive than Elasticsearch because it only indexes log metadata, not their entire content. This makes it an excellent choice for centralized logging on VPS, especially in conjunction with Grafana. It allows for efficient searching and analysis of logs, integrating them with metrics.
The choice of tool largely depends on your current needs, team size, budget, and willingness to invest time in configuration. For most startups on VPS/Dedicated, the combination of Prometheus + Grafana for metrics and Loki + Grafana for logs is the most balanced and cost-effective solution.
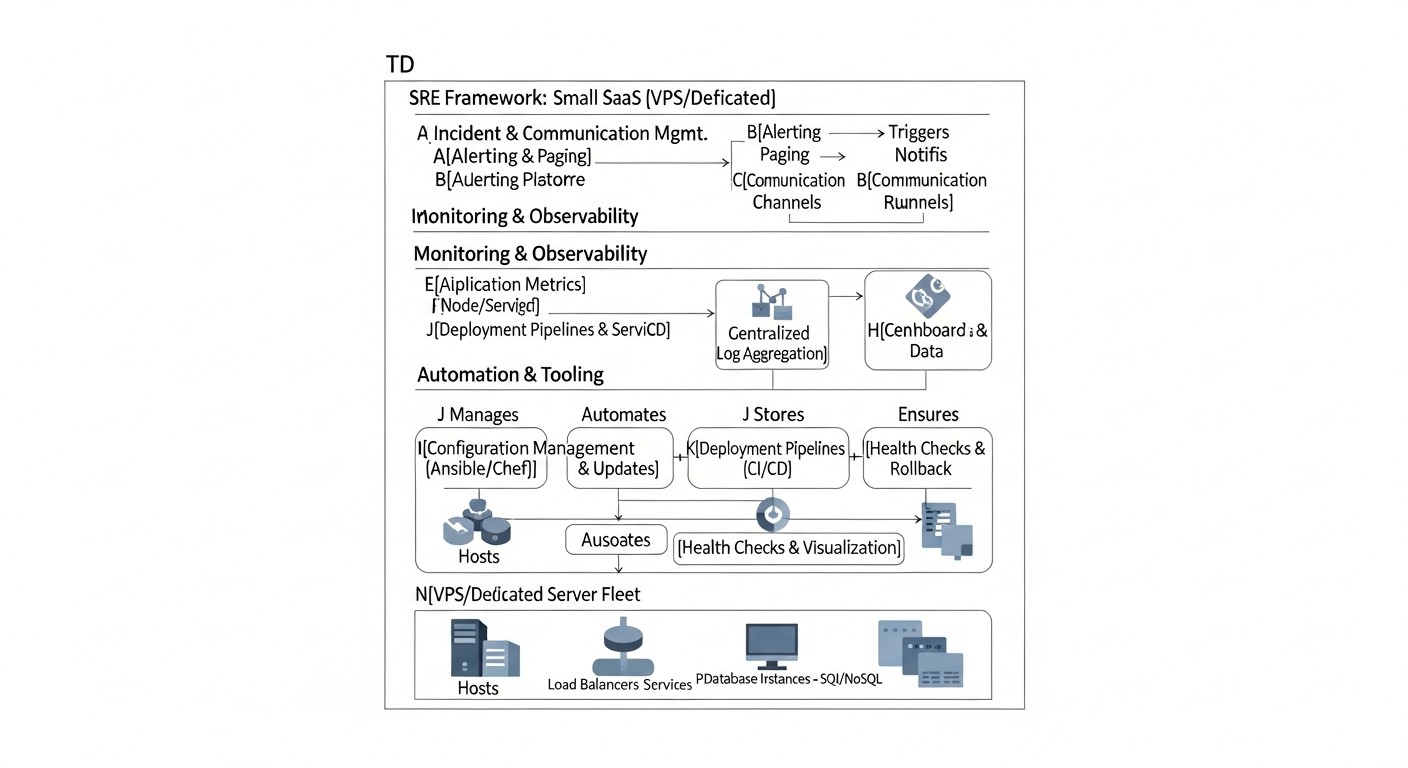
Detailed Review of Key SRE Practices
Implementing SRE in a startup or small team environment on VPS/Dedicated requires a pragmatic approach. Here, we delve into the details of each key practice, explaining how to effectively adapt it to your realities.
1. SLI, SLO, and Error Budget for Small Teams
SLI (Service Level Indicators) are your eyes on the system's state. To start, focus on what directly affects the user and is easily measurable. For a typical SaaS application on a VPS, this includes:
- Availability of the main API/Web Interface: Percentage of successful HTTP requests (2xx, 3xx) out of the total number of requests. Use external pings (UptimeRobot, Healthchecks.io) and internal metrics (Prometheus HTTP_exporter) for collection.
- Latency of critical operations: Response time for the most frequent or important requests (e.g., login, dashboard load, data saving). Track the 95th and 99th percentiles to understand not only the average but also the worst-case scenarios.
- Error Rate: Percentage of requests returning HTTP 5xx. It's also important to track application errors in logs that may not lead to 5xx but affect functionality.
SLO (Service Level Objectives) are your promises to yourselves and your users. Don't strive for unrealistic 99.999%. For a startup beginning with a VPS, 99.5% or 99.9% availability is an excellent goal, which means only 43 minutes of downtime per month for 99.9%. This provides room for maneuver, updates, and even minor incidents. Example: "API availability for clients must be ≥99.9% over the last 30 days," "95% of database queries must complete ≤100 ms." It's important that SLOs are aligned with business goals and team capabilities.
Error Budget is your "credit" for unreliability. If your SLO is 99.9%, you have 0.1% of the total service uptime that you can "spend" on incidents, planned work, or experiments. How to use it: If the error budget starts to deplete rapidly, it's a signal for the team to pause new feature development and focus on improving reliability. For example, if you've "spent" half of your monthly error budget in a week, it might be worth postponing a new feature release and refactoring a problematic component. This mechanism helps balance development speed and stability.
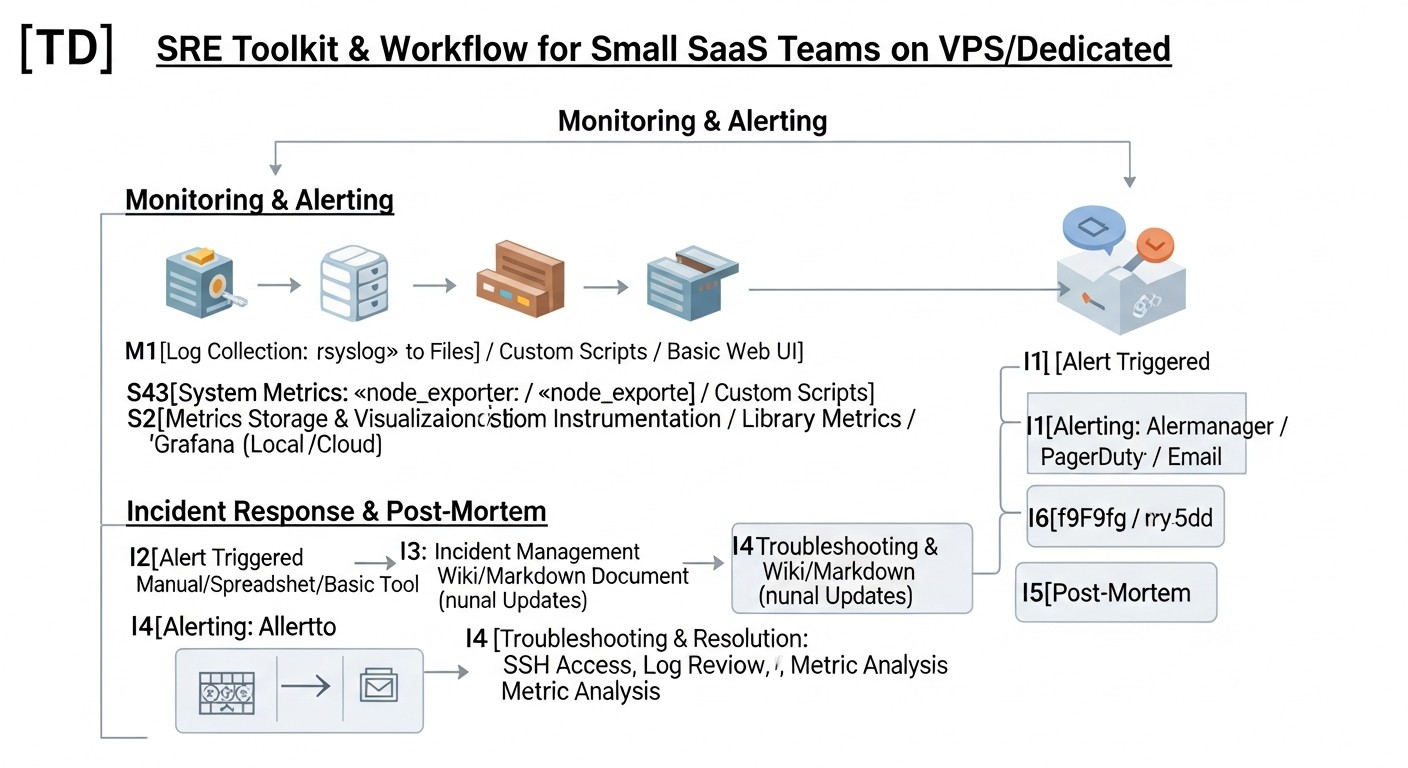
2. Practical Monitoring and Alerting
For VPS/Dedicated, monitoring is the cornerstone of SRE. Your goal is to see what's happening with the server and application and receive notifications before users notice a problem.
- Infrastructure Monitoring: Install Node Exporter on each VPS to collect CPU, RAM, disk, and network metrics. For containers, use cAdvisor.
- Application Monitoring: Integrate libraries for metric export (e.g., Prometheus client libraries) into your code. Track request count, latency, errors, queue status, JVM/Go/Node.js memory usage.
- Log Monitoring: Use Loki + Promtail to collect logs from your servers and applications. This will allow you to centrally search and analyze events, and create alerts based on log patterns.
- Synthetic Monitoring: Use external services (UptimeRobot, Healthchecks.io) or Blackbox Exporter for Prometheus to regularly check the availability and correctness of responses from your public endpoints externally.
Alerting: Configure Alertmanager to process alerts from Prometheus. Key principles:
- Specificity: Alerts should be as informative as possible: what broke, where, when, and what to do.
- Actionability: Alerts must require immediate action. If an alert doesn't require action, it's noise.
- Priorities: Categorize alerts by criticality. High-priority alerts (service unavailable) should wake up the team. Low-priority alerts (disk usage 80%) can be sent to Slack/Telegram.
- "Runbooks": Link each alert to a "runbook" – a short instruction on what to do when that alert triggers.
Real case: We reduced the number of "false" alerts by 70% after introducing the rule: "If an alert triggers more than 3 times a week and does not lead to a real incident, it is subject to review or deactivation." This forced the team to set more precise thresholds and focus on truly important problems.
3. Effective Incident Response for Small Teams
Even with the best monitoring, incidents happen. Your goal is to minimize Mean Time To Recover (MTTR). For a small team, this means:
- Clear On-Call Rotation: Even if there are only two of you, define who is on call during off-hours. Use simple tools: PagerDuty (has a free/cheap plan for small teams), Opsgenie, or even a custom script that sends notifications to Telegram/Slack on a schedule.
- Communication Channels: Designate a separate channel in Slack/Telegram for incidents. All communication should happen there.
- Runbooks: These are step-by-step instructions for resolving common problems. Store them in a Wiki or Git repository. Example: "Server X is unresponsive: 1) Check ping. 2) Check SSH. 3) Restart service Y. 4) Reboot VPS."
- Incident Manager: Appoint one person to coordinate actions during an incident, even if it's only 2-3 people. They are responsible for communication, not the technical solution.
- Rapid Diagnosis: Ensure every on-call person has access to monitoring, logs, and the ability to execute diagnostic commands on servers.
The secret to success is practice. Regularly conduct "drills," simulating minor incidents, so the team knows what to do.
4. Blameless Post-Mortem Culture
A Post-Mortem is not about finding blame, but a systemic analysis to prevent future problems. For startups:
- Conduct Post-Mortems for every significant incident: Define "significant" as any incident that violated an SLO or caused significant customer dissatisfaction.
- Focus on the system, not people: Questions like "What happened?", "Why?", "How did we discover it?", "What did we do?", "What could we have done better?", "What systemic changes are needed?".
- Document: Record findings, chronology, decisions made, and most importantly, "action items" – specific tasks for improvement (e.g., "Add alert for disk full," "Update deployment documentation," "Conduct Incident Response training").
- Assign owners and deadlines: Ensure each "action item" has an owner and a realistic completion date.
- Share lessons learned: Communicate findings to the entire team so everyone learns from each other's mistakes.
This helps create a culture of trust and continuous learning, which is especially important in rapidly growing teams.
5. Automation of Routine and Toil
Toil (routine, repetitive, non-long-term beneficial work) is the enemy of SRE. Automation is your best friend on VPS/Dedicated:
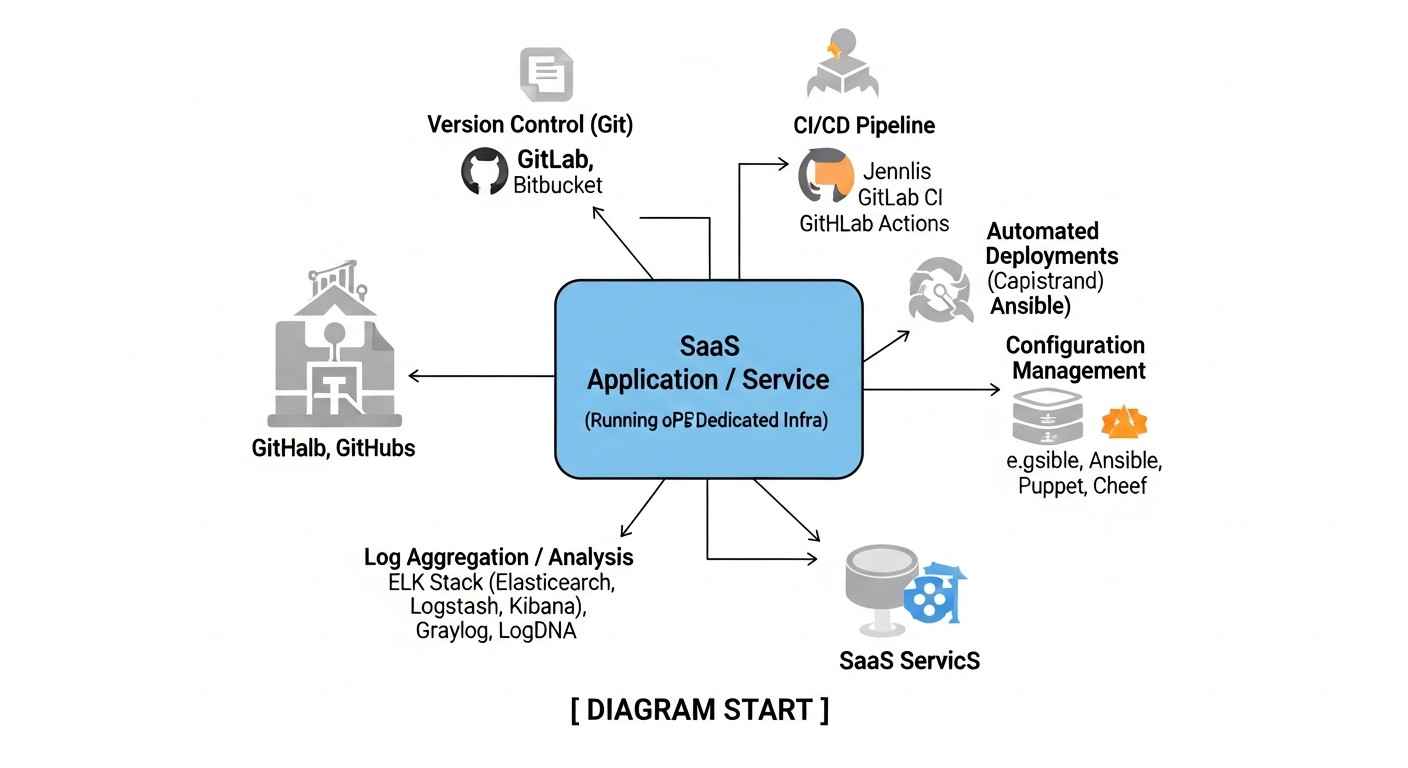
- Deployment (CI/CD): Use GitLab CI, GitHub Actions (with a self-hosted runner on your VPS), or Jenkins for automatic testing and code deployment on every commit. This reduces errors and speeds up releases.
- Configuration Management (IaC): Use Ansible for automatic server configuration, software installation, and management of configuration files. Even for a single VPS, this will save time and ensure consistency.
- Backup: Set up automatic backups of your database and important files to remote storage (S3-compatible storage, Rsync.net). Use scripts, cron jobs.
- Updates: Automate the installation of security patches for the OS (e.g., using `unattended-upgrades` in Debian/Ubuntu) and application dependencies.
- Health Checks: Scripts that check service status, free disk space, port availability, and send reports.
Start small: automate what you do most often and what is most prone to errors. For example, the process of deploying a new microservice or configuring a new VPS.
6. Observability on VPS/Dedicated
Even on a single server, Observability allows for a deeper understanding of what's happening.
- Metrics: As mentioned, Prometheus + Grafana. Collect metrics not only from the OS but also from the application itself.
- Logs: Loki + Promtail + Grafana. Ensure your application logs sufficient information (levels, context, User ID, Request ID).
- Tracing: For more complex applications with multiple services, even on a single VPS, tracing can be useful. Grafana Tempo is an open-source solution that can be deployed on the same VPS as Loki/Prometheus. Integrate OpenTelemetry SDK into your application to send traces.
Start with metrics and logs. This will give you 80% of the necessary information. Tracing is the next step when you have the resources and need for deeper analysis of distributed transactions.
Practical Tips and Implementation Recommendations
Moving from theory to concrete steps. Here you will find step-by-step instructions, command examples, and configurations that you can apply right now.
1. Installing the Basic Monitoring Stack (Prometheus + Grafana + Node Exporter) on a VPS
This is a "must-have" for any team on a VPS. We assume you have a VPS with Ubuntu 22.04.
Step 1: Install Prometheus
# Create user and directories
sudo useradd --no-create-home --shell /bin/false prometheus
sudo mkdir /etc/prometheus
sudo mkdir /var/lib/prometheus

# Download and extract Prometheus (actual version for 2026 may differ)
wget https://github.com/prometheus/prometheus/releases/download/v2.x.x/prometheus-2.x.x.linux-amd64.tar.gz
tar xvfz prometheus-2.x.x.linux-amd64.tar.gz
cd prometheus-2.x.x.linux-amd64

# Copy binaries and config
sudo cp prometheus /usr/local/bin/
sudo cp promtool /usr/local/bin/
sudo cp -r consoles /etc/prometheus
sudo cp -r console_libraries /etc/prometheus
sudo cp prometheus.yml /etc/prometheus/prometheus.yml # This will be the base config

# Set permissions
sudo chown -R prometheus:prometheus /etc/prometheus
sudo chown -R prometheus:prometheus /var/lib/prometheus
sudo chown prometheus:prometheus /usr/local/bin/prometheus
sudo chown prometheus:prometheus /usr/local/bin/promtool

# Create systemd service for Prometheus
sudo nano /etc/systemd/system/prometheus.service
Content of the file /etc/systemd/system/prometheus.service:
[Unit]
Description=Prometheus
Wants=network-online.target
After=network-online.target

[Service]
User=prometheus
Group=prometheus
Type=simple
ExecStart=/usr/local/bin/prometheus \
    --config.file /etc/prometheus/prometheus.yml \
    --storage.tsdb.path /var/lib/prometheus \
    --web.console.templates=/etc/prometheus/consoles \
    --web.console.libraries=/etc/prometheus/console_libraries \
    --web.listen-address="0.0.0.0:9090" \
    --storage.tsdb.retention.time=30d # Store data for 30 days

ExecReload=/bin/kill -HUP $MAINPID
Restart=on-failure

[Install]
WantedBy=multi-user.target
# Reload systemd and start Prometheus
sudo systemctl daemon-reload
sudo systemctl start prometheus
sudo systemctl enable prometheus
sudo systemctl status prometheus # Check status
Step 2: Install Node Exporter
# Create user
sudo useradd --no-create-home --shell /bin/false node_exporter

# Download and extract Node Exporter
wget https://github.com/prometheus/node_exporter/releases/download/v1.x.x/node_exporter-1.x.x.linux-amd64.tar.gz
tar xvfz node_exporter-1.x.x.linux-amd64.tar.gz
cd node_exporter-1.x.x.linux-amd64

# Copy binary
sudo cp node_exporter /usr/local/bin
sudo chown node_exporter:node_exporter /usr/local/bin/node_exporter

# Create systemd service for Node Exporter
sudo nano /etc/systemd/system/node_exporter.service
Content of the file /etc/systemd/system/node_exporter.service:
[Unit]
Description=Node Exporter
Wants=network-online.target
After=network-online.target

[Service]
User=node_exporter
Group=node_exporter
Type=simple
ExecStart=/usr/local/bin/node_exporter

[Install]
WantedBy=multi-user.target
# Reload systemd and start Node Exporter
sudo systemctl daemon-reload
sudo systemctl start node_exporter
sudo systemctl enable node_exporter
sudo systemctl status node_exporter
Step 3: Configure Prometheus to Scrape Metrics from Node Exporter
Edit /etc/prometheus/prometheus.yml, adding a job for Node Exporter:
# ... (rest of the config)
scrape_configs:
  - job_name: 'prometheus'
    static_configs:
      - targets: ['localhost:9090'] # Prometheus itself

  - job_name: 'node_exporter'
    static_configs:
      - targets: ['localhost:9100'] # Node Exporter on the same server
# Reload Prometheus to apply changes
sudo systemctl reload prometheus
Step 4: Install Grafana
# Add GPG key
sudo apt install -y apt-transport-https software-properties-common wget
wget -q -O - https://apt.grafana.com/gpg.key | sudo gpg --dearmor | sudo tee /etc/apt/keyrings/grafana.gpg > /dev/null

# Add Grafana repository
echo "deb [signed-by=/etc/apt/keyrings/grafana.gpg] https://apt.grafana.com stable main" | sudo tee /etc/apt/sources.list.d/grafana.list

# Update package list and install Grafana
sudo apt update
sudo apt install grafana -y

# Start and enable Grafana
sudo systemctl start grafana-server
sudo systemctl enable grafana-server
sudo systemctl status grafana-server
Grafana will be available at http://YOUR_IP:3000. Default login/password: admin/admin (change immediately!). Add Prometheus as a Data Source and import pre-built dashboards for Node Exporter (e.g., ID 1860, 11074).
2. Defining First SLOs and SLIs
Don't try to cover everything at once. Choose 1-2 of the most critical services and 1-2 SLIs for each.
- Service: Main API of your SaaS product.
- SLI 1: Availability (number of HTTP 2xx/3xx out of total API requests).
- SLO 1: 99.9% availability over 30 days.
- Error Budget: 0.1% of total uptime (approximately 43.2 minutes per month).
- SLI 2: Response Latency (95th percentile for POST /login requests).
- SLO 2: 95% of POST /login requests must complete in less than 500 ms over 7 days.
- Error Budget: 5% of requests may exceed 500 ms.
Use Prometheus Alertmanager to create alerts that trigger when you are approaching the exhaustion of your error budget, not just when the SLO is already violated. This gives you time to react.
# Example rule for Prometheus Alertmanager
groups:
  - name: service_availability
    rules:
      - alert: HighAvailabilityErrorRate
        expr: |
          sum(rate(http_requests_total{job="my_api", status=~"5.."}[5m])) by (job) / sum(rate(http_requests_total{job="my_api"}[5m])) by (job) > 0.001
        for: 5m
        labels:
          severity: critical
        annotations:
          summary: "High 5xx error rate on API {{ $labels.job }}"
          description: "More than 0.1% of requests to API {{ $labels.job }} are returning 5xx errors within 5 minutes. This threatens our 99.9% SLO."
          runbook: "https://your-wiki.com/runbooks/api_5xx_errors"
3. Example of a Simple Runbook for "High CPU Load on VPS" Incident
This can be a simple file in a Git repository or a page in a Wiki.
# Runbook: High CPU Load on VPS

**Incident Name:** High CPU Load (over 90% for 5 minutes) on VPS {{ $labels.instance }}

**Priority:** P1 (Critical), immediate response

**Goal:** Identify and eliminate the cause of high CPU load, restore normal operation.

**Responsible:** On-call engineer

---

**Diagnosis and Resolution Steps:**

1.  **Confirm Incident:**
    *   Check current CPU load via Grafana (Node Exporter dashboard).
    *   Connect to VPS via SSH: `ssh user@{{ $labels.instance }}`

2.  **Identify the Culprit Process:**
    *   Execute `top` or `htop` to view processes consuming the most CPU.
    *   Note the `PID` and `COMMAND` of high-consumption processes.

3.  **Log Analysis:**
    *   If the culprit is your application, check its logs for errors or anomalies:
        `journalctl -u your_app_service.service -f`
        (or view logs via Loki/Grafana, if configured).
    *   Check system logs: `journalctl -f`

4.  **Attempt Recovery (Non-Disruptive):**
    *   If the culprit is your application, try restarting it:
        `sudo systemctl restart your_app_service.service`
    *   If it's a known bug or temporary load, consider temporary scaling (if possible) or reducing load.

5.  **Attempt Recovery (Disruptive):**
    *   If restarting the service didn't help, and the VPS remains overloaded, consider rebooting the entire VPS:
        `sudo reboot` (first ensure this won't lead to data loss and notify the team).

6.  **Documentation:**
    *   Record all steps taken, causes found, and results in the incident tracker (Jira, Notion).
    *   Assemble the team for a Post-Mortem if the incident was serious or recurring.

---

**Additional Diagnostic Commands:**
*   `sudo dmesg -T` - kernel messages
*   `free -h` - RAM usage
*   `df -h` - disk usage
*   `netstat -tunlp` - open ports and connections
4. Example of Automated Deployment with GitLab CI (for VPS)
Suppose you have a NodeJS application and want to deploy it to a VPS on every commit to the `main` branch.
.gitlab-ci.yml file in the root of your repository:
stages:
  - build
  - deploy

variables:
  # Configure SSH key for VPS access in GitLab CI/CD Variables
  # SSH_PRIVATE_KEY: your SSH private key
  # SSH_USER: user on VPS (e.g., deploy_user)
  # SSH_HOST: IP or domain of your VPS

build_job:
  stage: build
  image: node:18-alpine
  script:
    - npm install
    - npm test
    - npm run build # If you have a build step (e.g., for React/Vue frontend)
  artifacts:
    paths:
      - node_modules/
      - dist/ # Or build/
  only:
    - main

deploy_job:
  stage: deploy
  image: alpine/git # Lightweight image with Git and SSH
  before_script:
    - apk add openssh-client # Install SSH client
    - eval $(ssh-agent -s)
    - echo "$SSH_PRIVATE_KEY" | tr -d '\r' | ssh-add - # Add private key
    - mkdir -p ~/.ssh
    - chmod 700 ~/.ssh
    - ssh-keyscan -H "$SSH_HOST" >> ~/.ssh/known_hosts # Add host to known_hosts
    - chmod 644 ~/.ssh/known_hosts
  script:
    - echo "Deploying to $SSH_USER@$SSH_HOST..."
    - ssh "$SSH_USER@$SSH_HOST" "mkdir -p /var/www/my-app" # Create directory if it doesn't exist
    - scp -r node_modules/ "$SSH_USER@$SSH_HOST:/var/www/my-app/"
    - scp -r dist/ "$SSH_USER@$SSH_HOST:/var/www/my-app/" # Copy built files
    - scp package.json "$SSH_USER@$SSH_HOST:/var/www/my-app/"
    - scp app.js "$SSH_USER@$SSH_HOST:/var/www/my-app/" # Copy main application files
    - ssh "$SSH_USER@$SSH_HOST" "cd /var/www/my-app && sudo systemctl restart my-app-service" # Restart service
    - echo "Deployment completed!"
  only:
    - main
On your VPS, there should be a user (e.g., `deploy_user`) with SSH access and `sudo` configured to restart the service without a password. Also, ensure your application runs as a systemd service.
5. Optimizing Monitoring Costs
- Use open-source: Prometheus, Grafana, Loki, Alertmanager, Node Exporter – all are free. Your costs are VPS resources.
- Save disk space: Configure a short data retention period in Prometheus (e.g., 30 days using
--storage.tsdb.retention.time=30d). For logs in Loki, you can also configure TTL. - Limit metric cardinality: Avoid creating metrics with a very large number of unique labels (e.g., with User ID as a label), as this inflates the Prometheus database.
- Optimize queries: In Grafana, try to use aggregating functions and lower-resolution queries for long periods.
- Consider small VPS for monitoring: If your main VPS is already under load, allocate a separate, less powerful VPS specifically for Prometheus, Grafana, and Loki. This will distribute the load and increase the fault tolerance of the monitoring itself.
Our experience shows that even a basic set of Prometheus, Grafana, and Loki on a separate VPS with 2 CPU, 4GB RAM, and 80GB SSD can comfortably serve monitoring and logging for several small SaaS services.
Common Mistakes When Implementing SRE in Startups
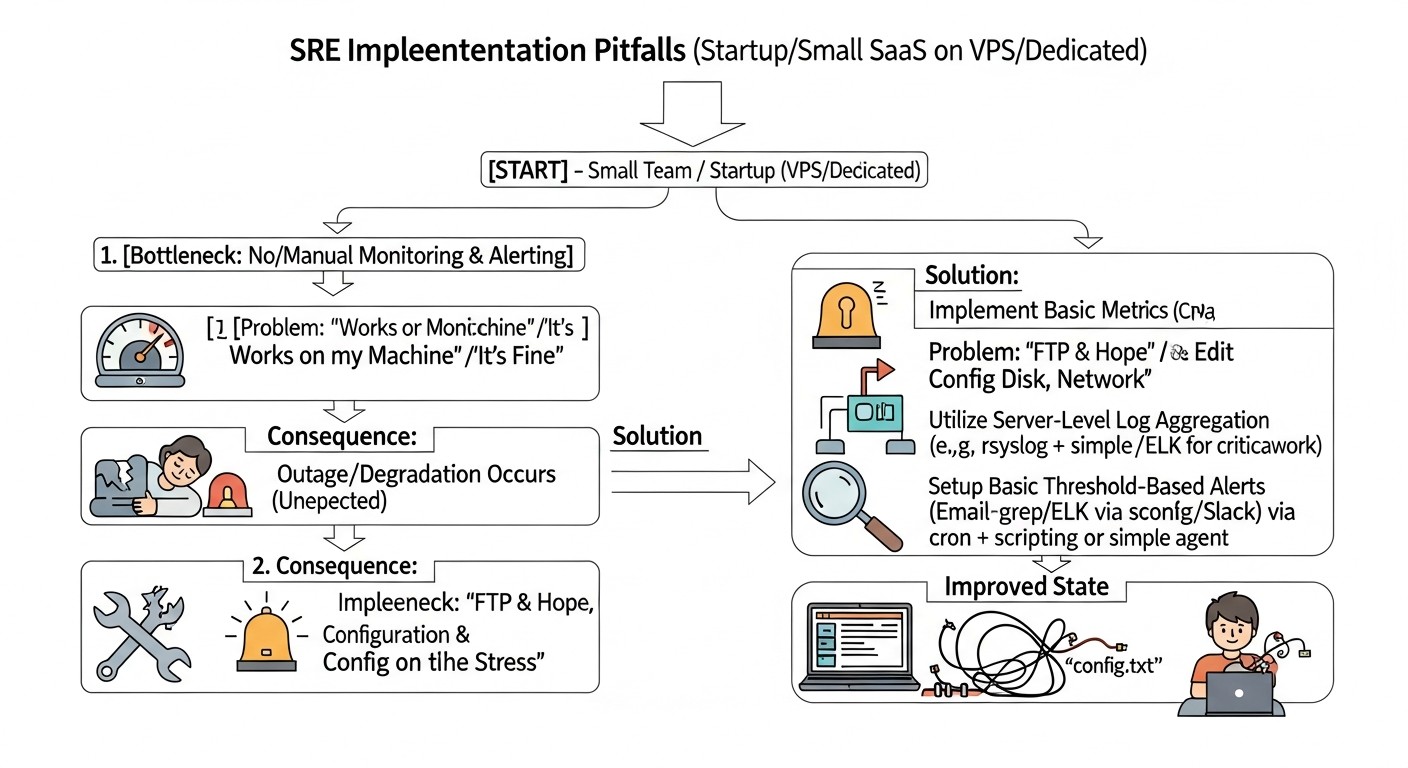
Implementing SRE is a journey fraught with pitfalls, especially when resources are limited. Knowing common mistakes will help you avoid them and save time, nerves, and money.
1. Ignoring or Incorrectly Defining SLI/SLO
Mistake: Either not defining SLI/SLO at all, or copying them from large companies (e.g., striving for 99.999% availability), or choosing metrics that do not reflect the actual user experience.
How to avoid: Start with 1-2 most critical SLIs that directly impact revenue or customer retention (e.g., main API availability, key page load speed). Set realistic SLOs (99.5%-99.9% to start) and review them regularly. Involve the business in the SLO definition process so they understand the trade-offs between reliability and development speed.
Consequences: Lack of clear goals leads to chaotic priorities, constant stress from "firefighting," and inability to measure real progress in reliability. Unrealistic SLOs lead to team burnout and a constant feeling of failure.
2. Alert Fatigue
Mistake: Setting up too many alerts, alerts for non-critical events, alerts without a clear "runbook," or alerts that trigger too often without a real problem.
How to avoid: Follow the principle that "every alert should require action." If an alert triggers but doesn't require immediate intervention (e.g., "disk usage 70%"), convert it to an informational message in Slack or adjust the threshold. Set up escalation: first to a general chat, then to the on-call person. Ensure every alert has an associated "runbook."
Consequences: The team starts ignoring alerts, leading to missed real incidents and increased downtime. This also severely undermines morale and causes burnout.
3. Absence or Ineffective Post-Mortem Process
Mistake: Not conducting Post-Mortems at all, or conducting them to find blame, or conducting them but not documenting findings and not completing "action items."
How to avoid: Make Post-Mortem a mandatory practice after every significant incident. Emphasize the blameless nature of the process, focusing on systemic causes. Clearly document the chronology, causes, steps taken, and most importantly, specific "action items" with owners and deadlines. Regularly track the completion of these tasks.
Consequences: The team constantly repeats the same mistakes, incidents recur, and a culture of blame suppresses initiative and honesty, hindering learning and improvement.
4. Over-complication and "Golden Cage"
Mistake: Trying to implement all "trendy" SRE tools and practices at once, without considering the current team size, budget, and system complexity. For example, implementing full-fledged distributed tracing for a monolith on a single VPS.
How to avoid: Start with the basics: basic monitoring, centralized logs, simple SLOs. Implement SRE iteratively, adding new practices and tools as needs and resources grow. Focus on "good enough" solutions, not "perfect" ones. Use open-source and simple solutions until there is a real need for commercial products.
Consequences: Excessive complexity leads to slow implementation, high costs, difficulties in maintenance, and provides no real benefit, causing frustration and rejection of SRE practices.
5. Ignoring Automation and Technical Debt
Mistake: Postponing automation "for later" or believing that "doing it manually is faster." Ignoring the accumulation of technical debt in infrastructure and code, which makes the system fragile and difficult to maintain.
How to avoid: Allocate time for automating routine tasks (deployment, backup, updates). Even small scripts can save hours. Include technical debt work in regular planning (e.g., 10-20% of a sprint). Use Post-Mortem results to identify critical technical debt.
Consequences: Increased "toil," human errors, slow and unpredictable releases, high maintenance costs, and a constant threat to system stability. Accumulated technical debt ultimately slows down the development of new features.
6. Lack of a Clear Incident Response Plan
Mistake: Assuming "someone will figure it out" when something breaks, or lacking a clear notification and action procedure.
How to avoid: Create a simple but clear Incident Response plan: who is on call, how they are notified, who is the incident commander, where communication takes place, where "runbooks" are stored. Conduct regular "drills" so the team knows their roles.
Consequences: Chaos during an incident, panic, slow recovery, leading to prolonged downtime, customer loss, and reputational damage.
7. Absence of Backups or Their Ineffectiveness
Mistake: Complete absence of backups, or having backups that have never been tested for functionality, or storing them on the same server as the primary service.
How to avoid: Implement regular automatic backups of all critical data (databases, configurations, user files). Store copies in remote, independent storage (e.g., S3-compatible cloud). Regularly (at least quarterly) test the functionality of restoring from backups.
Consequences: Data loss in case of server failure, attack, or human error, which can be catastrophic for a SaaS business and lead to its closure.
SRE Practical Application Checklist
This step-by-step algorithm will help you systematize the implementation of SRE practices in your small team on VPS/Dedicated. Go through the items and mark your progress.
Phase 1: Preparation and Planning
- Identify critical services:
- List 1-3 key services of your SaaS product that directly impact user value and revenue.
- Example: Backend API, web interface, authorization service.
- Select key SLIs:
- For each critical service, choose 1-2 most important SLIs (availability, latency, error rate) that are easy to measure and reflect the user experience.
- Example: API availability, 95th percentile of POST /login latency.
- Set realistic SLOs:
- For each SLI, define a realistic goal (e.g., 99.9% availability, 95% of requests < 500ms). Discuss and agree on them with the team and stakeholders.
- Example: API availability SLO = 99.9% over 30 days.
- Define the error budget:
- Calculate the allowable downtime or number of errors corresponding to your SLOs.
- Example: Error budget for 99.9% availability = 43.2 minutes per month.
- Choose monitoring and logging tools:
- For VPS/Dedicated, consider Prometheus + Grafana for metrics and Loki + Promtail for logs.
- Example: Decided to use Prometheus, Grafana, Node Exporter, Loki, Promtail.
Phase 2: Implementing Basic Practices
- Deploy the monitoring stack:
- Install Prometheus, Node Exporter, and Grafana on your main or a separate VPS.
- Configure Prometheus to collect metrics from Node Exporter and, if necessary, from your application.
- Set up centralized logging:
- Install Loki and Promtail. Configure Promtail to collect your application and system logs.
- Connect Loki as a data source in Grafana.
- Create initial dashboards:
- In Grafana, import pre-built dashboards for Node Exporter.
- Create your own dashboards for monitoring your SLIs (availability, latency, application errors).
- Configure basic alerting:
- Install and configure Alertmanager.
- Create alerts for critical events (e.g., service unavailable, high error rate, error budget exhaustion).
- Set up notifications in Slack/Telegram or via PagerDuty/Opsgenie.
- Develop simple Runbooks:
- For each critical alert, create a short, step-by-step instruction for diagnosing and resolving the problem.
- Store them in an easily accessible location (Wiki, Git repository).
- Set up automatic backups:
- Implement scripts for automatic backup of the database and important files.
- Configure backup storage on a remote, independent resource.
- Test the backup restoration procedure.
Phase 3: Development and Optimization
- Implement automated deployment (CI/CD):
- Set up GitLab CI/GitHub Actions with a self-hosted runner or Jenkins for automated testing and deployment of your application.
- Start conducting Post-Mortems:
- After each significant incident, conduct a blameless Post-Mortem.
- Document findings and create "action items" with owners and deadlines.
- Optimize alerts:
- Regularly review alerts, eliminate "noise," and set more precise thresholds.
- Ensure each alert truly requires action.
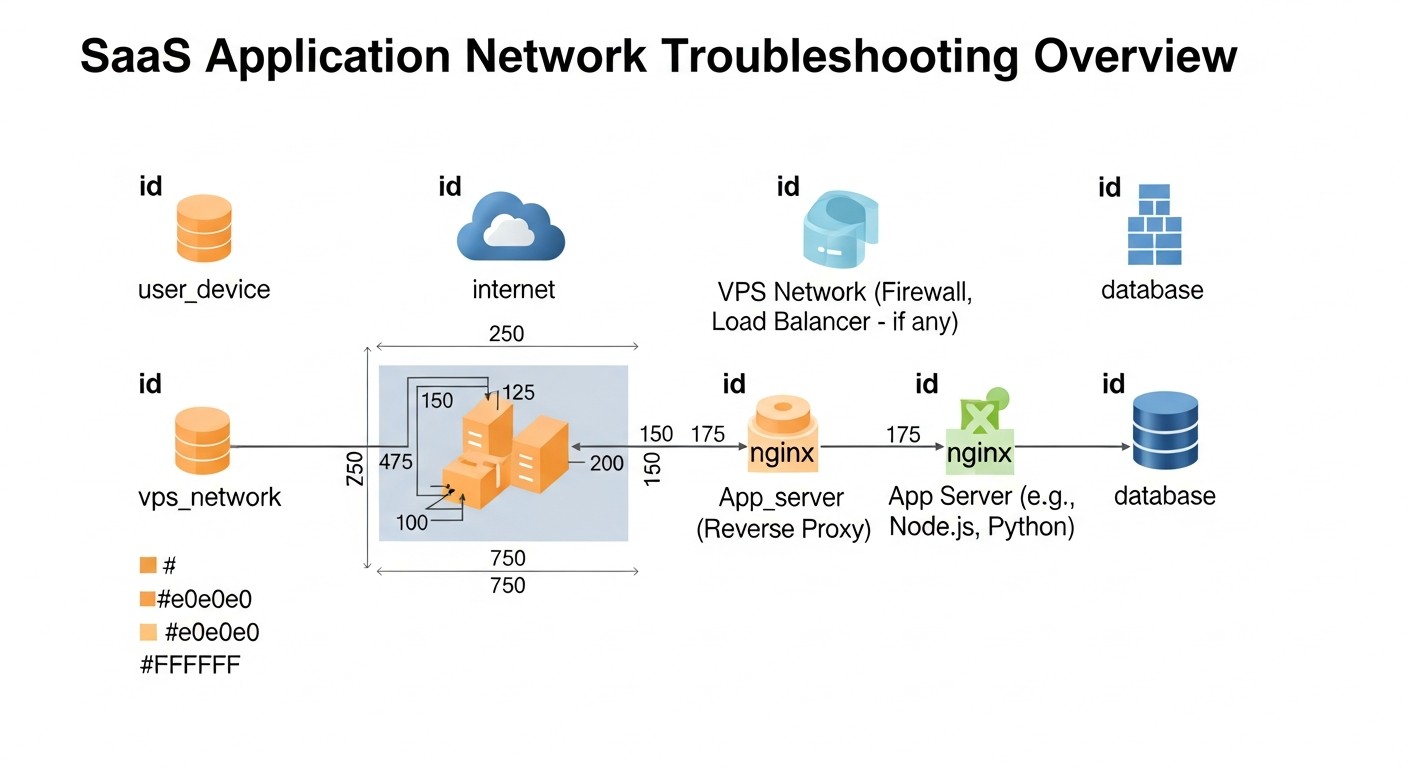
- Document infrastructure and processes:
- Create a simple diagram of your infrastructure.
- Describe key processes (deployment, incident response, updates).
- Regularly review SLOs and SLIs:
- Quarterly or upon significant product changes, review the relevance and achievability of your goals.
- Invest in team training:
- Encourage learning SRE principles and tools.
- Conduct internal "drills" for incident response.
Cost Calculation / SRE Economics
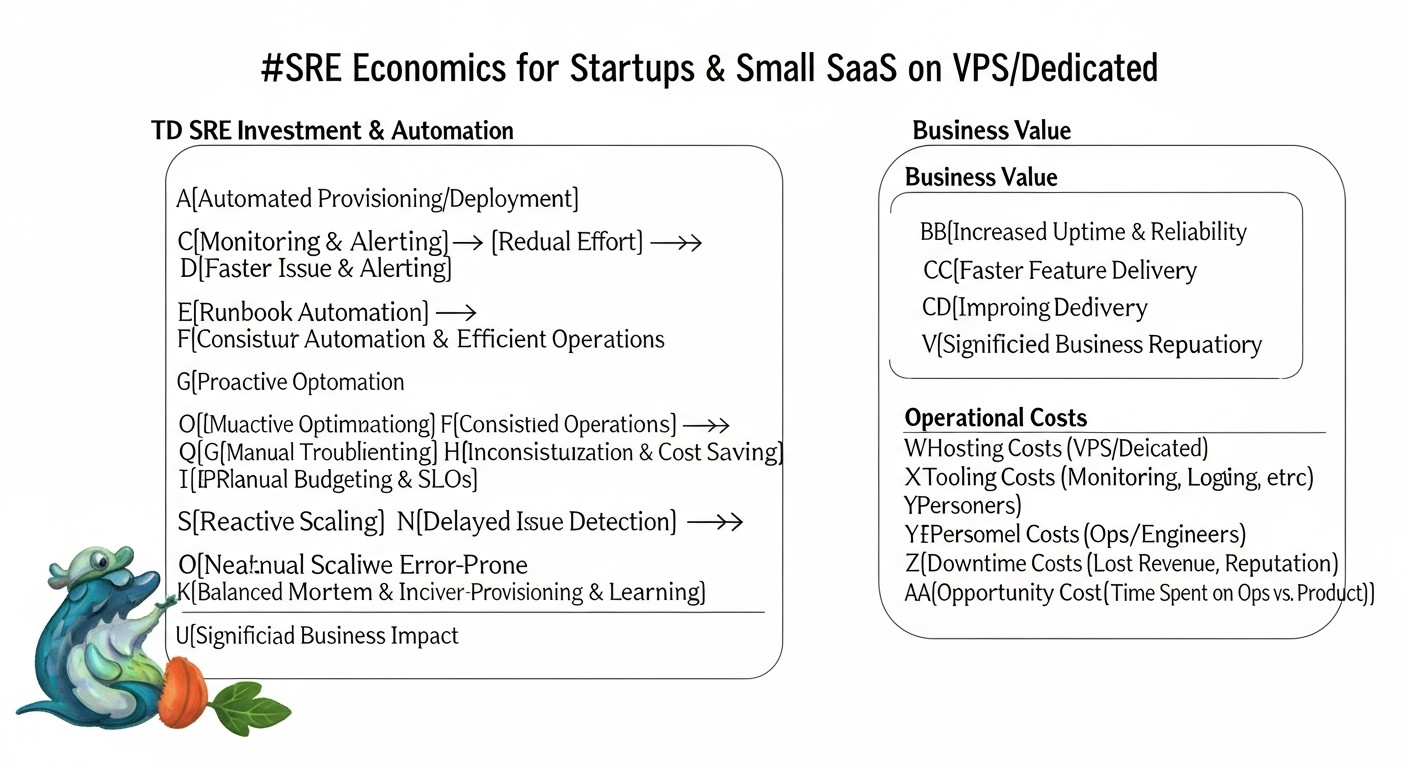
One of the main reasons why startups and small teams on VPS/Dedicated choose this path is the desire to optimize costs. SRE, at first glance, might seem like an additional expense, but in reality, it's an investment that pays off many times over. Let's break down the economics of SRE.
1. Cost of Downtime
Before discussing SRE costs, it's necessary to understand how much the absence of SRE costs. Every hour of downtime for your SaaS product is not just a technical failure; it represents direct and indirect losses for the business.
- Direct revenue loss: If your product is not working, customers cannot use it, meaning you lose potential sales, subscriptions, and transactions.
- Example: A SaaS project with 1000 active paid users, each bringing in $20/month. Daily revenue = (1000 * $20) / 30 = ~$667. Hourly revenue = ~$28. If downtime lasts 4 hours, direct losses will be $112.
- Loss of reputation and customer trust: This is a more difficult-to-measure, but often more destructive factor. An unreliable service deters new customers and causes existing ones to leave.
- Example: After a 4-hour downtime, 5% of customers might cancel their subscription. This is 50 customers * $20/month = $1000/month in lost revenue, multiplied by the customer's lifetime value.
- SLA penalties: If you have an SLA with customers, every hour of downtime can lead to financial compensation.
- Example: An SLA provides for a 10% refund for the month if availability falls below 99.5%. One serious incident could cost you a significant portion of your monthly revenue.
- Operational costs: Time spent by the team "firefighting" instead of working on new features. This is lost profit and reduced productivity.
- Example: 3 engineers spent 4 hours each resolving an incident. If the average hourly cost of an engineer is $50, this is $600.
In summary: Even a small 4-hour downtime can cost a startup hundreds or thousands of dollars in direct losses, not to mention long-term damage to reputation and customer churn. Investment in SRE is insurance against these losses.
2. Calculating SRE Costs for VPS/Dedicated
The good news is that SRE practices don't have to be expensive. The main costs are for:
- VPS/Dedicated resources: For hosting SRE tools (Prometheus, Grafana, Loki).
- Estimate: A separate small VPS (2 CPU, 4GB RAM, 80GB SSD) for monitoring and logging could cost $15-30/month in 2026. If hosted on the main server, the "cost" is a portion of its resources.
- Team time: For implementing, configuring, and supporting SRE tools and processes. This is the most significant "hidden" cost.
- Estimate: Initial SRE implementation (basic monitoring, alerts, Post-Mortem) might require 10-20% of one engineer's working time over 1-2 months. Thereafter, 5-10% of time for support and improvement.
- Paid third-party services (optional): For alerting (PagerDuty, Opsgenie), external monitoring (UptimeRobot Pro), remote backup (S3-compatible storage).
- Estimate: PagerDuty/Opsgenie (Starter) $10-25/month, UptimeRobot Pro $10-20/month, S3 storage $5-15/month (depends on volume).
Approximate monthly cost calculation for a small SaaS on VPS (2026):
| Cost Category | Description | Approximate Cost ($/month) | Notes |
|---|---|---|---|
| VPS for main application | 1x VPS (4 CPU, 8GB RAM, 160GB SSD) | $40-70 | For hosting the application |
| VPS for SRE tools | 1x VPS (2 CPU, 4GB RAM, 80GB SSD) | $15-30 | For Prometheus, Grafana, Loki, Alertmanager |
| Remote storage for backups | S3-compatible storage (500GB) | $5-15 | Important for data recovery |
| Alerting service (optional) | PagerDuty/Opsgenie (Starter Plan) | $10-25 | For on-call rotation and escalation |
| External monitoring (optional) | UptimeRobot Pro | $10-20 | For external availability checks |
| Engineer time (share) | 10% of one engineer's time ($50/hour * 160 hours * 0.1) | $800 | The largest "cost," but it's an investment in stability |
| Total approximate cost | $880 - $980 | Includes resource costs and engineer time |
As you can see, most of the cost comes from engineer time. However, this is time that would otherwise be spent on "firefighting," routine work, or solving problems that could have been prevented. SRE converts these reactive costs into proactive investments.
3. How to Optimize Costs
- Maximize open-source usage: Prometheus, Grafana, Loki, Ansible, GitLab CI (self-hosted runner) – all are free.
- Consolidate resources: If your main VPS has spare resources, you can host Prometheus, Grafana, and Loki on it, saving on a separate VPS. However, this reduces the fault tolerance of monitoring itself.
- Iterative implementation: Don't try to implement everything at once. Start with the cheapest and most effective practices (basic monitoring, alerts, Post-Mortem) and gradually expand.
- Automate Toil: The more routine tasks you automate, the less time engineers spend on "toil," freeing them up for more valuable work.
- Team training: Investing in training the team on SRE principles increases their efficiency and reduces the need to hire expensive specialized experts.
The economics of SRE for a startup on VPS/Dedicated is that these practices allow you to gain the benefits of a large business (stability, reliability, predictability) at much lower costs, preventing much more expensive consequences of downtime and customer loss.
Case Studies and Practical Examples
Theory is important, but real-world examples help to better understand how SRE practices are applied in practice. Here are 2-3 realistic scenarios from our experience working with startups and small SaaS teams on VPS/Dedicated.
Case 1: Increasing Availability and Reducing Stress in the SaaS Startup "TaskFlow"
Problem: "TaskFlow" – a SaaS project management platform, running on a single powerful VPS. A team of 3 developers constantly faced unpredictable downtimes (2-3 times a month for 1-2 hours), caused by peak loads or bugs in new releases. Monitoring was minimal (only uptime pings), and incident response was chaotic and stressful. This led to customer loss and team burnout.
Solution:
- SLI/SLO Implementation: Identified that critical SLIs were the availability of the main API (task creation/editing) and response latency on the main dashboard. Set SLOs: 99.8% API availability and 95% of dashboard requests < 800ms.
- Monitoring Stack: Deployed Prometheus + Grafana + Node Exporter on the same VPS. Integrated the Prometheus client library into the Node.js backend to collect application metrics (request count, errors, latencies).
- Alerting: Configured Alertmanager to send critical alerts to a dedicated Telegram channel. Alerts triggered if availability dropped below 99.5% or latency exceeded 1.5 seconds.
- Incident Management: Created a simple on-call schedule (rotating weekly). Developed 5 basic "runbooks" for the most common problems (high CPU, DB error, service unavailability).
- Post-Mortem: After each incident, conducted a 30-minute "blameless" Post-Mortem, documenting the chronology and "action items."
Results:
- Availability: Over 3 months, API availability increased from 97-98% to a stable 99.9%.
- MTTR: Mean Time To Recover decreased from 1-2 hours to 15-30 minutes.
- Stress Reduction: The team felt more confident with a clear action plan. The number of night awakenings due to false alerts decreased by 80%.
- Product Improvement: "Action items" from Post-Mortems led to the optimization of several "bottlenecks" in the code and database configuration, which improved overall performance.
This case demonstrates how even on a single VPS, basic SRE practices can significantly improve reliability and team performance.
Case 2: Managing Error Budgets and Optimizing Release Cycle in the E-commerce Project "ShopBoost"
Problem: "ShopBoost" – a small e-commerce project on a dedicated server, frequently released new features. However, each new release carried the risk of performance degradation or bugs, leading to sales losses. The development team was under pressure from the business, which demanded new features but also constantly complained about instability.
Solution:
- Error Budget: After defining SLOs for availability (99.9%) and error rate (less than 0.2%), the team established an error budget. If more than 50% of the monthly error budget was "spent" in a week, new releases were paused.
- Improved Monitoring: In addition to Prometheus/Grafana, Loki was implemented for centralized collection of application and web server logs. This allowed for quick identification of errors related to new releases.
- CI/CD Automation: GitLab CI with a self-hosted runner on the server was configured for automated deployment. Each commit underwent basic tests, then was automatically deployed to staging, and after manual testing – to production.
- Post-Mortem with a Focus on Releases: Every incident related to a release was thoroughly analyzed. Special attention was paid to how the problem could have been prevented during development or testing.
Results:
- Balance "Features vs. Stability": The error budget became a clear indicator of when to "slow down" with new features and focus on stability. This reduced conflicts between development and business.
- Release Quality: The number of critical bugs reaching production decreased by 60% due to improved testing and quality control.
- Deployment Speed: Time from commit to production decreased from several hours (manual deploy) to 15-20 minutes (automated deploy).
- Quality Culture: Developers became more attentive to testing and monitoring their changes, understanding that this directly affects their ability to release new features.
This case shows how SRE helps manage risks and optimize the development cycle, finding a balance between innovation and stability.
Case 3: Scaling and Resource Optimization for the Analytical Service "DataInsight"
Problem: "DataInsight" – a startup providing data analytics for small businesses, faced growth challenges. Their service, running on two VPS, periodically slowed down or crashed due to resource shortages (especially RAM and CPU) when processing large reports. The team didn't understand when and which resources needed scaling, and often acted reactively, buying more powerful VPS "just in case."
Solution:
- Capacity Planning: Detailed monitoring of resource usage (CPU, RAM, Disk I/O) was implemented using Prometheus + Grafana. Metrics were collected every 15 seconds.
- Resource-based SLI/SLO: SLIs were defined for CPU usage (< 80% for 10 minutes) and RAM (< 90% free memory). SLOs were set based on these metrics.
- Proactive Alerts: Alerts were configured in Alertmanager that triggered when resource usage approached critical thresholds (e.g., CPU > 70% for more than 5 minutes).
- Trend Analysis: Resource usage graphs in Grafana were regularly analyzed to forecast future needs. For example, if RAM consumption consistently grew by 10% per month, a VPS upgrade was planned in 2-3 months.
- Code Optimization: Post-Mortems after resource shortage incidents led to the identification of "heavy" database queries and inefficient data processing algorithms, which were then optimized.
Results:
- Cost Optimization: Instead of reactively buying more powerful VPS, the team started making informed decisions. For example, instead of upgrading the entire server, they were able to optimize database queries, which postponed the need to purchase more expensive hardware by 6 months, saving up to $300 per month.
- Stability: The number of resource-related incidents decreased by 90%.
- Proactivity: The team began to plan upgrades or optimizations in advance, avoiding surprises.
This case highlights how an SRE approach to monitoring and capacity planning allows startups to scale effectively, avoiding unnecessary expenses and ensuring service stability.
Tools and Resources
For successful implementation of SRE practices, even on VPS/Dedicated, you will need an arsenal of reliable and effective tools. We will focus on solutions that have proven their value for small teams, offering an excellent balance of functionality and cost.
1. Monitoring and Metric Visualization
- Prometheus: A system for collecting and storing time-series metrics. It is the de facto standard for cloud and container monitoring, but also perfectly suited for VPS.
- Grafana: A powerful platform for visualizing metrics. It allows you to create informative dashboards, configure alerts, and explore data from various sources (Prometheus, Loki, databases).
- Node Exporter: A Prometheus metric exporter that collects data about the operating system's state (CPU, RAM, disk, network). Must be installed on each VPS.
- cAdvisor: A Prometheus metric exporter that collects data about containers (Docker). Useful if your application runs in containers on a VPS.
- Blackbox Exporter: A Prometheus exporter that allows you to check the availability and correctness of HTTP/HTTPS, TCP, ICMP endpoints from within your infrastructure.
- UptimeRobot / Healthchecks.io: External services for monitoring the availability of your public endpoints from different geographical locations. UptimeRobot has a generous free plan.
2. Logging and Tracing
- Loki: A log aggregation system developed by Grafana Labs. Less resource-intensive than Elasticsearch, as it only indexes log metadata. Integrates perfectly with Grafana.
- Promtail: An agent for Loki that collects logs from your servers and sends them to Loki.
- Grafana Tempo: A distributed tracing system, also from Grafana Labs. Allows collecting and storing OpenTelemetry traces, integrating with metrics and logs in Grafana.
- OpenTelemetry: A set of tools, APIs, and SDKs for instrumenting your application, allowing it to generate metrics, logs, and traces in a unified format.
3. Alert Management and On-Call
- Alertmanager: A Prometheus component that processes alerts, deduplicates them, groups them, and sends them to the necessary channels (Slack, Telegram, PagerDuty, email).
- PagerDuty / Opsgenie: Professional services for managing on-call rotations, alert escalation, and scheduling duties. Offer free or inexpensive plans for small teams.
- Telegram / Slack: Simple and free channels for sending alerts. Alertmanager easily integrates with them.
4. Automation and Infrastructure as Code (IaC)
- Ansible: A simple but powerful tool for configuration management, application deployment, and task orchestration. Does not require agents on managed servers. Ideal for VPS/Dedicated.
- GitLab CI / GitHub Actions: Continuous Integration/Continuous Deployment (CI/CD) systems. Allow automating testing and code deployment. Can use a self-hosted runner on your VPS.
- Bash / Python scripts: Underestimated but extremely powerful tools for automating specific tasks on a VPS.
5. Documentation and Knowledge Management
- Wiki (Confluence, Notion, DokuWiki): For storing runbooks, Post-Mortem reports, infrastructure, and process documentation.
- Git repositories: For storing configurations (IaC), scripts, runbooks as Markdown files.
6. Useful Books and Resources
- "Site Reliability Engineering: How Google Runs Production Systems" and "The Site Reliability Workbook": Classic books from Google, although focused on large-scale systems, the basic principles are applicable everywhere.
- Blogs of Grafana Labs, Prometheus, Incident.io: Regularly publish useful articles and case studies.
- DevOps and SRE Communities: Telegram chats, Discord servers, Stack Overflow.
Start by mastering Prometheus and Grafana, then add Loki. Gradually implement automation with Ansible and CI/CD. Remember that tools are just means; the main things are the principles and culture of SRE.
Troubleshooting: Solving Common Problems
Even with the best SRE practices, production problems are inevitable. The ability to quickly diagnose and resolve them is a key skill. Below are typical problems faced by small SaaS teams on VPS/Dedicated, and practical commands for their resolution.
1. High CPU Load
Symptoms: Slow application performance, response delays, high CPU alerts.
Diagnosis:
toporhtop: Shows processes sorted by CPU consumption. Look for processes consuming >80-90% CPU.uptime: Shows the system's average load over 1, 5, and 15 minutes. If the load average is higher than the number of CPU cores, the system is overloaded.- Grafana (Node Exporter dashboard): Visual analysis of CPU usage trends.
- Application logs: Look for errors, "heavy" database queries, infinite loops, or resource-intensive operations.
Solution:
- If the culprit is your application:
- Restart the service:
sudo systemctl restart your_app_service.service - If it's a temporary peak, consider optimizing the code or database.
- If the problem is persistent, consider upgrading the VPS or scaling to multiple servers.
- Restart the service:
- If the culprit is another process (e.g., some script, cron job):
- Identify what the process is and why it's consuming a lot of resources.
- Optimize the script or change its execution schedule.
2. Insufficient RAM
Symptoms: Application crashes with Out Of Memory errors, slow performance, active use of the swap partition.
Diagnosis:
free -h: Shows total RAM, used and free, as well as swap usage.htop: Shows RAM consumption by each process.- Grafana (Node Exporter dashboard): Monitoring RAM and swap usage.
- Application logs: Look for Out Of Memory errors.
Solution:
- If your application consumes too much RAM:
- Optimize the code (e.g., avoid loading large amounts of data into memory, use streaming processing).
- Increase memory limits for your application (if possible, e.g., JVM parameters).
- Consider upgrading the VPS with more RAM.
- If other processes consume RAM:
- Stop unnecessary services.
- Optimize the configuration of other services (e.g., reduce the number of web server worker processes).
3. Disk Space Full
Symptoms: File write errors, application crashes, inability to install new packages.
Diagnosis:
df -h: Shows disk space usage by partition. Look for partitions that are 90% or more full.du -sh /path/to/directory: Shows the size of a specific directory. Use this to find "heavy" directories (e.g.,/var/log,/var/lib/docker,/tmp).- Grafana (Node Exporter dashboard): Monitoring disk usage.
Solution:
- Clean up logs:
sudo journalctl --vacuum-size=1G(for systemd journal)- Manually delete old application logs or configure logrotate.
- Clear caches:
sudo apt clean(for Debian/Ubuntu)- Clear your application's caches.
- Delete unnecessary files:
- Old backups, temporary files, unused Docker images.
- If the problem is persistent, consider upgrading the VPS disk or moving large data to external storage.
4. Network Problems
Symptoms: Slow connections, timeout errors, inability to connect to services.
Diagnosis:
ping google.com: Check external resource availability.ping localhost: Check network card.netstat -tunlp: Shows open ports and active connections. Ensure your application is listening on the correct port.ss -tulpn: Netstat equivalent, often faster.ip a: Shows network interfaces and their IP addresses.traceroute example.com: Trace route to a remote host.- Grafana (Node Exporter dashboard): Monitoring network traffic.
Solution:
- Check firewall (
sudo ufw statusor iptables rules). - Ensure the application is listening on
0.0.0.0or the correct IP if it should be accessible externally. - Check DNS configuration (
cat /etc/resolv.conf). - If the problem is on the VPS provider's side, contact their support.
5. Application Crashes / HTTP 5xx Errors
Symptoms: Users see error pages, API returns 5xx, application fails to start.
Diagnosis:
- Application logs: This is your primary source of information. Look for stack traces, error messages, warnings. Use Loki/Grafana for quick searching.
sudo systemctl status your_app_service.service: Checks systemd service status.sudo journalctl -u your_app_service.service -f: Shows your service's logs in real-time.- Metric monitoring: Anomalies in request count, latency, errors.
Solution:
- Restart the service:
sudo systemctl restart your_app_service.service. - If the problem recurs, analyze logs to find the root cause (code bug, DB issue, external service problem).
- Check application configuration files.
- Rollback to a previous stable version if the problem appeared after a release.
When to Contact VPS Provider Support
Don't hesitate to contact support if:
- You cannot connect to the VPS via SSH, and the problem is not with your network settings.
- Your VPS does not respond to pings, but the application should be running.
- There are network problems clearly unrelated to your configuration (e.g., packet loss to your VPS).
- Hardware (disk, RAM) shows signs of physical failure.
- Your VPS has been attacked or blacklisted.
Always provide the provider with as much information as possible: exact start time of the problem, observed symptoms, results of your diagnostic commands.
Frequently Asked Questions (FAQ)
Do I need a full-time SRE engineer in a startup?
In the initial stage, when the team consists of a few people, a dedicated SRE engineer is likely not needed. SRE functions can be performed by DevOps engineers or even backend developers with an operational focus. It's important that SRE principles are integrated into the team's culture, and everyone takes responsibility for reliability. A full-time SRE engineer becomes relevant when the team grows to 10-15+ people, and system complexity significantly increases.
How to choose the first SLI/SLO?
Start with what is most critical for your business and directly impacts the user. For most SaaS, this is the availability of the main API/web interface and the latency of key user operations (e.g., login, data saving). Set realistic SLOs (e.g., 99.9% availability), not ideal "five nines," which will require unjustified effort and cost.
How much does SRE implementation cost?
Direct costs for SRE on VPS/Dedicated can be minimal if open-source tools (Prometheus, Grafana, Loki) are used. The main "cost" is your team's time for implementing and supporting these practices. This is an investment that pays off by reducing downtime, improving reputation, and preventing customer loss. For a basic monitoring stack on a separate VPS, you can stay within $15-30/month for the server itself, plus a portion of an engineer's salary.
Can I do without paid tools?
Absolutely. For startups on VPS/Dedicated, open-source solutions (Prometheus, Grafana, Loki, Ansible) are an ideal choice. They provide powerful functionality, flexibility, and do not require monthly payments. Paid services (e.g., PagerDuty, Datadog) can simplify some aspects, but are not mandatory to start.
How to combat 'alert fatigue'?
The key to combating 'alert fatigue' is quality, not quantity, of alerts. Each alert should be actionable, require immediate intervention, and have a clear "runbook." Regularly review alerts, disable those that don't provide value, and set more precise thresholds. Use different channels for alerts of varying criticality (e.g., PagerDuty for critical, Slack for informational).
What is the difference between SRE and DevOps?
DevOps is a broader cultural and methodological philosophy aimed at improving collaboration between development and operations. SRE is a specific implementation of DevOps principles, focused on applying engineering approaches to operational problems. SRE uses metrics, automation, and risk management to achieve specific reliability goals (SLOs), while DevOps covers the entire development and deployment lifecycle.
What if I only have one server?
Even for a single server, SRE practices are very useful. Start with basic monitoring (Prometheus + Node Exporter + Grafana on the same server), centralized logging (Loki + Promtail), automated backups, and simple SLOs. This will help you better understand the server's state, quickly react to problems, and prevent them. Having a single server makes SRE even more critical, as there is no redundancy.
How to convince the team to spend time on SRE?
Show the team the direct benefits: fewer "fires," fewer night awakenings, a more stable product that customers love. Explain that SRE is not additional work, but a systematization and automation of what they already do, but more efficiently. Involve the team in defining SLOs and Post-Mortems so they feel ownership and see results.
Which metrics are most important for SaaS?
For SaaS, metrics directly related to user experience and business goals are most important:
- Availability (service is running and accessible).
- Latency (application response speed).
- Error Rate (number of errors visible to users).
- Throughput (ability to handle load).
- Resource metrics (CPU, RAM, disk) for capacity planning.
How often should Post-Mortems be conducted?
Post-Mortems should be conducted after every incident that violated your SLO or caused significant customer dissatisfaction. For a startup, this might be 1-2 times a month, or sometimes more often. More important than frequency is quality: focus on learning lessons and creating concrete "action items" that will be executed.
How to start automation?
Start with the most routine and error-prone tasks. This could be automating code deployment (CI/CD), backups, installing updates, or configuring a new server. Use simple tools like Bash scripts or Ansible. Gradually automate more processes, freeing up time for more complex work.
Conclusion
Implementing SRE practices for startups and small SaaS teams on VPS/Dedicated is not a luxury, but a strategic necessity in the highly competitive market of 2026. We have seen that the principles of Site Reliability Engineering, originally developed for Google's scale, can be successfully adapted and applied even with limited resources, bringing significant benefits.
Key takeaways you should carry from this article:
- Pragmatism is your best friend: Don't strive for perfection immediately. Start small, choose 1-2 critical SLIs and realistic SLOs, gradually expanding coverage.
- Monitoring is the foundation of everything: Without reliable monitoring, you will be "firefighting" blindly. Open-source solutions like Prometheus and Grafana provide powerful capabilities at minimal cost.
- Automation is the path to efficiency: Reduce "toil" (routine work) with scripts, Ansible, and CI/CD. This will free up engineers' time and reduce human errors.
- A culture of learning, not blaming: Blameless Post-Mortems are a powerful tool for continuous improvement and preventing incident recurrence.
- SRE is an investment: The time and resources invested in SRE pay off by reducing downtime, improving reputation, decreasing team stress, and accelerating the development of new features.
Next steps for the reader:
- Assess current state: Audit your current infrastructure and processes. Where are the "bottlenecks"? What problems occur most often?
- Choose the first "pilot" service: Start with the most critical or most problematic service.
- Define the first SLIs and SLOs: Agree on them with the team and business.
- Implement a basic monitoring stack: Install Prometheus, Node Exporter, Grafana, and Loki. Configure dashboards for your SLIs.
- Set up alerts: Create several critical alerts that will trigger before an SLO is violated.
- Develop the first Runbook: For one of your critical alerts.
- Conduct the first Post-Mortem: After the next significant incident, even if it's small.
- Automate one routine task: For example, backup or deployment.
Remember, SRE is not a one-time project, but a continuous process of improvement. Start small, iterate, and you will see your startup become more reliable, predictable, and successful. Good luck!
Was this guide helpful?