Full Observability for Distributed Systems: OpenTelemetry, Loki and Tempo on VPS 2026
TL;DR
- OpenTelemetry is the 2026 standard for telemetry collection. It unifies the collection of metrics, logs, and traces, making your system ready for future changes and avoiding vendor lock-in.
- Loki is the optimal choice for logs on a VPS. Its metadata-based indexing allows for efficient storage and querying of logs even with limited resources, which is critical for budget-friendly solutions.
- Tempo is the ideal solution for distributed tracing. It uses object storage, minimizing RAM and CPU requirements, which makes it extremely suitable for VPS infrastructure in 2026.
- Integration with Grafana — your unified dashboard. All three components easily integrate with Grafana, providing a centralized interface for visualizing and analyzing all telemetry.
- Cost savings on VPS in 2026 — it's real. Proper configuration of OpenTelemetry Collector, data filtering, and storage optimization can significantly reduce costs, especially for traffic and disk space.
- A practical approach — key to success. Start small, implement gradually, automate deployment, and don't forget regular audits of configurations and resource consumption.
- Be ready for scaling. Even on a VPS, the architecture of OpenTelemetry, Loki, and Tempo allows for relatively easy scaling, transitioning to more powerful instances or clusters as the project grows.
Introduction
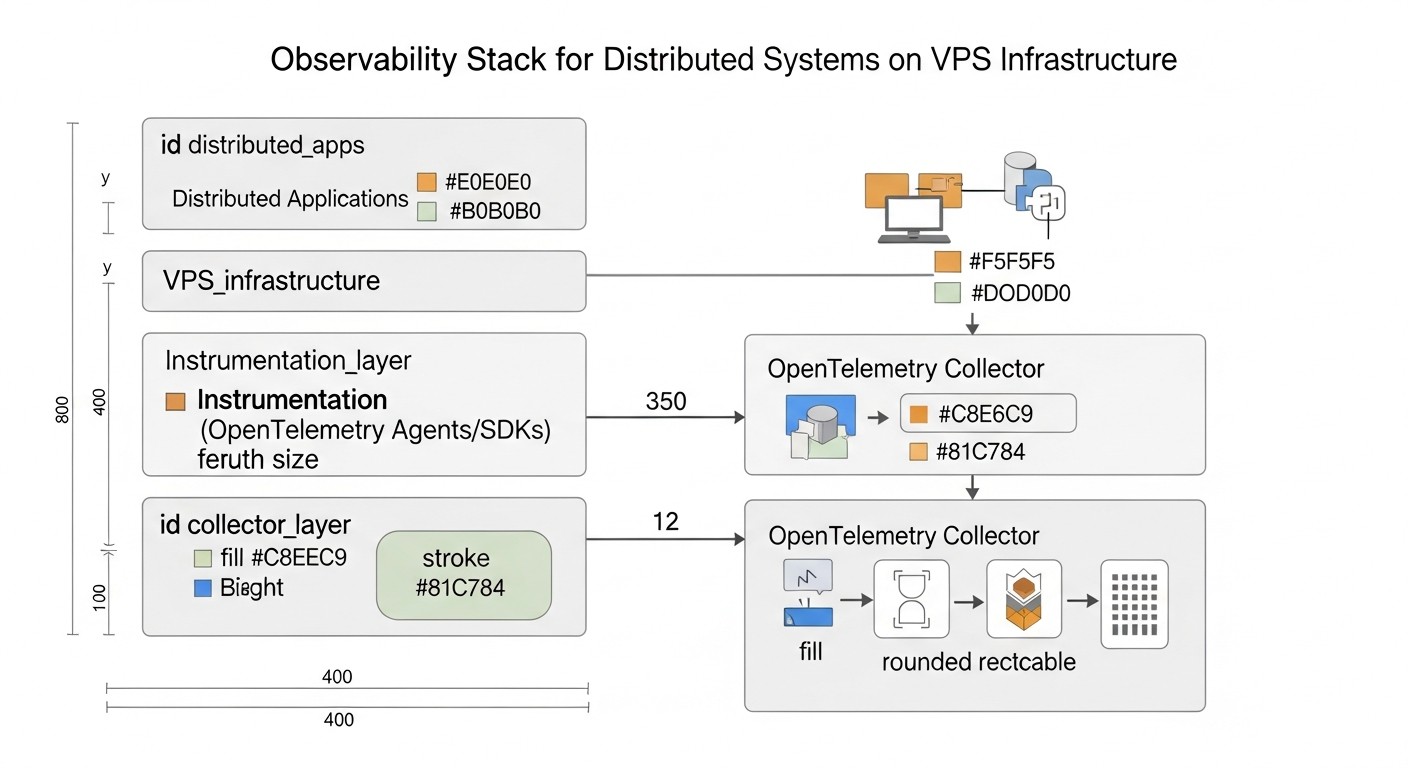 Diagram: Introduction
By 2026, the software development landscape has undergone significant changes. Monolithic applications have given way to distributed microservice architectures, cloud technologies have become ubiquitous, and the concepts of "serverless" and edge computing continue to gain momentum. Along with this evolution, system complexity also grows. The failure of one of dozens or hundreds of microservices can lead to cascading failures, and finding the root cause of a problem in a tangled network of interactions becomes a real nightmare without adequate tools.
This is where the concept of full observability comes into play. Unlike traditional monitoring, which answers the question "What happened?", Observability allows you to answer "Why did it happen?", providing a deep understanding of the system's internal state through three main pillars: metrics, logs, and traces. In 2026, when downtime is measured not only in money but also in reputation, and user experience is a key competitive advantage, Observability ceases to be a luxury and becomes an absolute necessity.
This article is dedicated to building a full-fledged Observability system for distributed systems, using the combination of OpenTelemetry, Loki, and Tempo, deployed on a Virtual Private Server (VPS). We will focus on practical aspects relevant to 2026, considering the constantly growing demands for performance, efficiency, and, of course, cost. We will demonstrate how, even with a limited budget and VPS resources, a high level of observability can be achieved, comparable to more expensive cloud solutions.
Who is this article for? Primarily, for DevOps engineers and system administrators looking for effective and economical solutions for monitoring and diagnostics. It will be useful for Backend developers (Python, Node.js, Go, PHP) striving to integrate Observability into their applications. SaaS project founders and startup CTOs will find practical advice here on optimizing costs and improving the reliability of their products using advanced open technologies.
We will explore why this particular combination of tools is one of the most promising and cost-effective for VPS in 2026, how to configure it correctly, what mistakes to avoid, and how to derive maximum benefit for your business.
Key Criteria/Selection Factors
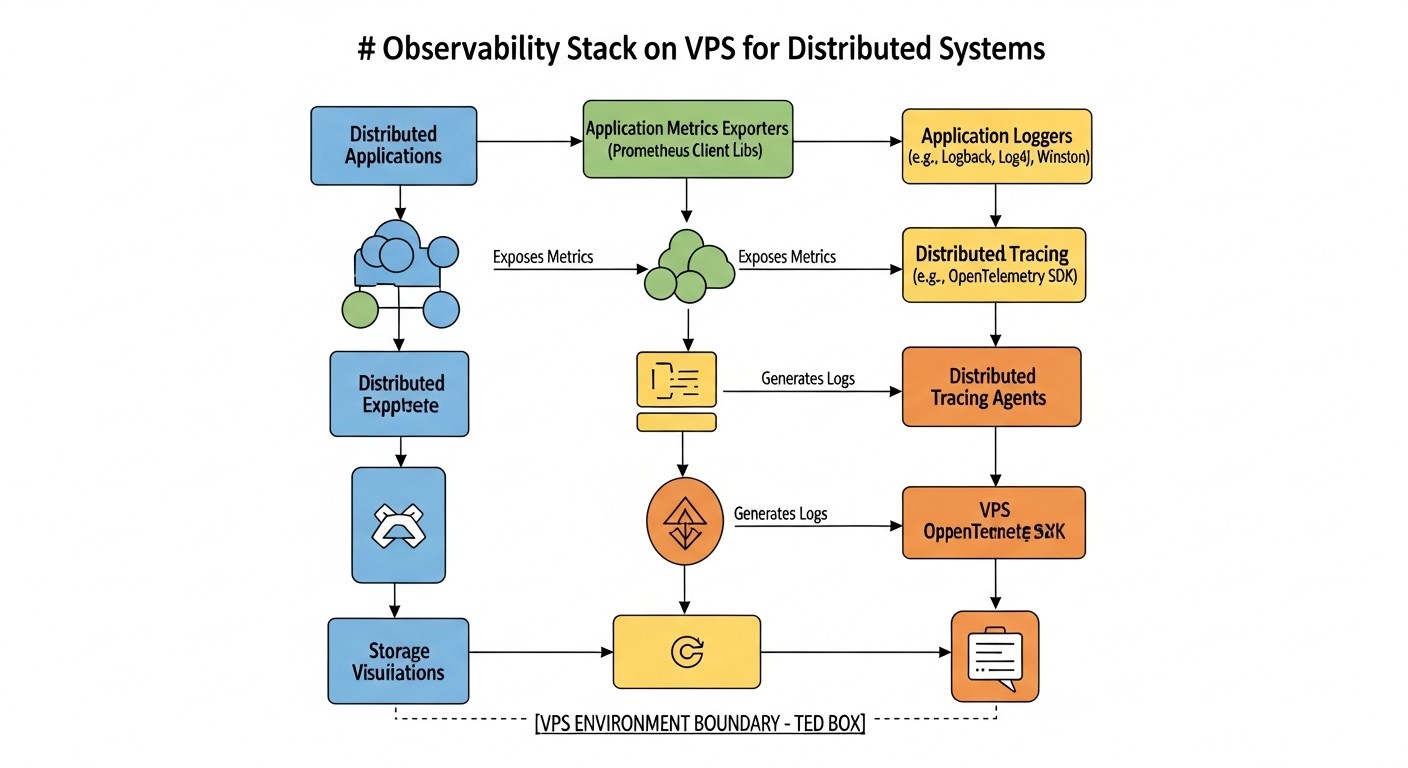 Diagram: Key Criteria/Selection Factors
Choosing the right tools for Observability is not just about following trends, but a strategic decision that directly impacts the reliability, performance, and ultimately, the business success of a project. In 2026, when dealing with distributed systems on a VPS, a number of critically important factors must be considered.
1. Total Cost of Ownership (TCO)
This is perhaps the most important factor for projects using a VPS. TCO includes not only direct costs for servers and storage but also indirect ones: engineer time for setup, support, scaling, and potential losses from downtime. Solutions must be resource-efficient, minimizing CPU, RAM, and disk space consumption, as well as traffic, which is often a significant expense item on a VPS. We will look for tools that allow storing a large volume of data for reasonable money.
2. Ease of Deployment and Management
On a VPS, engineer resources are often limited. Systems that are complex to install and configure can quickly become a burden. We need solutions that can be quickly deployed, easily updated, and maintained without the need for deep dives into their internal workings. Documentation, community, and the availability of ready-made configurations play a key role here.
3. Scalability and Performance
Even on a VPS, the system must be capable of handling a growing volume of telemetry without performance degradation. This means efficient resource utilization, horizontal scaling (if transitioning to multiple VPS instances is required), and the ability to cope with peak loads. This is especially important for logs and traces, whose volume can be unpredictable.
4. Flexibility and Extensibility
The world of technology is constantly changing. The chosen tools must be flexible enough to adapt to new data sources, protocols, and integrations. OpenTelemetry is the gold standard here, providing a unified approach to data collection. The ability to easily add new services and applications to the Observability system is critical.
5. Data Depth and Quality
Tools must provide sufficiently detailed and accurate data (metrics, logs, traces) to effectively diagnose problems. The ability to add custom attributes (tags) to data, aggregate them by various dimensions, and perform complex queries is the foundation for deep analysis.
6. Ecosystem Integration
An Observability system does not exist in a vacuum. It must easily integrate with other tools in your stack: alerting systems (Alertmanager), dashboards (Grafana), CI/CD pipelines, etc. The more seamless the integration, the more effective the entire development and operations process becomes.
7. Openness and Standards
Using open standards and projects with an active community reduces the risk of vendor lock-in and ensures long-term support. OpenTelemetry is a prime example of this approach, becoming the de facto standard for telemetry. Open projects also often offer more flexible solutions and adapt faster to new requirements.
8. Security
Telemetry often contains sensitive data. Tools must ensure secure data transmission and storage, support authentication and authorization, and provide capabilities for masking or filtering confidential information.
How to evaluate each criterion:
- TCO: Compare not only the VPS cost but also the estimated traffic volume, disk space for storing logs/traces, and the projected time engineers will spend on support. Use provider calculators and test deployments.
- Ease of Deployment: Evaluate the number of installation steps, the complexity of configuration files, and the availability of Docker images and Helm charts (if Kubernetes is used on a VPS).
- Scalability: Study the tool's architecture. Does it support horizontal scaling? What are the resource recommendations for different data volumes?
- Flexibility: Check which protocols the tool supports for data ingestion, if there's an API for extending functionality, and how easily new data sources can be added.
- Data Depth: Look at examples of dashboards and queries. How detailed information can be obtained? Can data be filtered and aggregated by many parameters?
- Integration: Check for ready-made connectors, plugins, and documentation for integration with Grafana, Alertmanager, and other tools.
- Openness: Assess GitHub activity, the number of contributors, release frequency, and the availability of a public roadmap.
- Security: Review security documentation: data encryption in transit and at rest, access mechanisms.
Considering these criteria, the combination of OpenTelemetry, Loki, and Tempo on a VPS in 2026 appears to be one of the most balanced and promising solutions.
Comparative Table of Observability Solutions
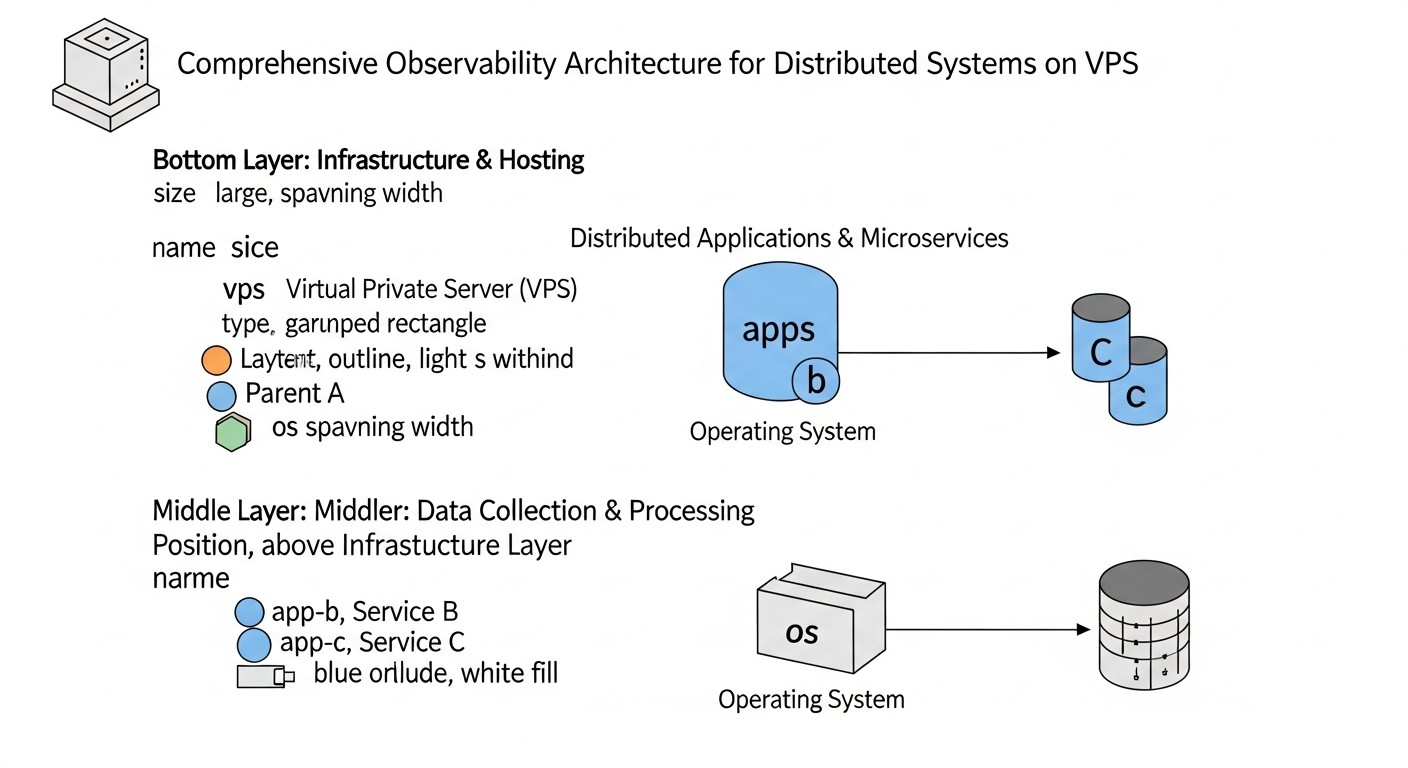 Diagram: Comparative Table of Observability Solutions
To understand the advantages of the chosen stack, let's compare OpenTelemetry, Loki, and Tempo with other popular solutions relevant for 2026, especially in the context of VPS usage. We will focus on key aspects: data type, cost, complexity, scalability, and main features.
| Criterion |
OpenTelemetry (Collection) |
Loki (Logs) |
Tempo (Traces) |
Prometheus (Metrics) |
Elastic Stack (ELK) |
Jaeger (Traces) |
Cloud Provider (Managed Observability) |
| Data Type |
Metrics, Logs, Traces (universal collector) |
Logs |
Traces |
Metrics (pull-model) |
Logs, Metrics, Traces (via Filebeat, Metricbeat, APM) |
Traces |
Metrics, Logs, Traces (comprehensively) |
| Cost (VPS, 2026) |
Low (collector only, CPU/RAM) |
Medium (storage on S3-compatible, CPU/RAM for queries) |
Low (storage on S3-compatible, minimal CPU/RAM) |
Medium (disk storage, CPU/RAM) |
High (requires significant RAM/CPU/disk) |
Medium (requires Cassandra/Elasticsearch, CPU/RAM/disk) |
High (subscription-based, price per data volume) |
| Deployment Complexity |
Medium (Collector + agents) |
Medium (Loki + Promtail) |
Low (Tempo + OpenTelemetry Collector) |
Medium (Prometheus + Exporters) |
High (Elasticsearch, Kibana, Logstash/Beats) |
High (Collector, Query, Agent, Storage) |
Low (configuration via UI/API) |
| Scalability on VPS |
High (horizontal Collector scaling) |
Medium (separation into ingester/querier, object storage) |
High (object storage, minimal resources) |
Medium (Federation, Thanos/Cortex for cluster) |
Low (very resource-intensive for a cluster) |
Medium (with external DB) |
Very High (managed by provider) |
| Data Storage |
None (buffering only) |
Object storage (S3-compatible), metadata index |
Object storage (S3-compatible), trace ID index |
Local disk (TSDB) |
Local disk (Lucene/inverted index) |
Cassandra, Elasticsearch, Kafka |
Managed by provider (proprietary solutions) |
| Features for VPS in 2026 |
Universal standard, vendor-agnostic, active development, broad language support. |
Efficient log storage, low RAM/CPU requirements, excellent Grafana integration, Cloud Object Storage backend support. |
Minimal RAM/CPU requirements, trace storage in object storage, "store everything" approach, fast queries by trace ID. |
De facto standard for metrics, pull-model, powerful PromQL query language, active community. |
Powerful analytics, full-text search, but very resource-intensive, making it expensive for VPS. |
Open standard for tracing, but requires a powerful DBMS for storage, which increases VPS cost. |
Convenience, no management required, but high cost per data volume and vendor lock-in. |
| Grafana Integration |
Yes (via Prometheus/Loki/Tempo) |
Yes (native) |
Yes (native) |
Yes (native) |
Yes (via plugin) |
Yes (via plugin) |
Yes (often native or via API) |
From the table, it is clear that the combination of OpenTelemetry, Loki, and Tempo offers a unique balance between functionality, performance, and cost, especially for deployment on VPS in 2026. Moving away from resource-intensive databases for storing logs and traces in favor of object storage (S3-compatible) is a key factor that significantly reduces TCO and simplifies management.
Prometheus remains the standard for metrics and is often used with OpenTelemetry Collector for collecting and aggregating metrics. Elastic Stack, while powerful, is excessively expensive and complex for most VPS projects. Cloud providers offer convenience, but their pricing policy for data volume can quickly become prohibitive for startups and small teams.
Thus, OpenTelemetry as a universal collector, Loki for economical log storage, and Tempo for traces on object storage, complemented by Grafana for visualization, represent an optimal solution for Observability on VPS in 2026.
Detailed Overview of OpenTelemetry, Loki, and Tempo
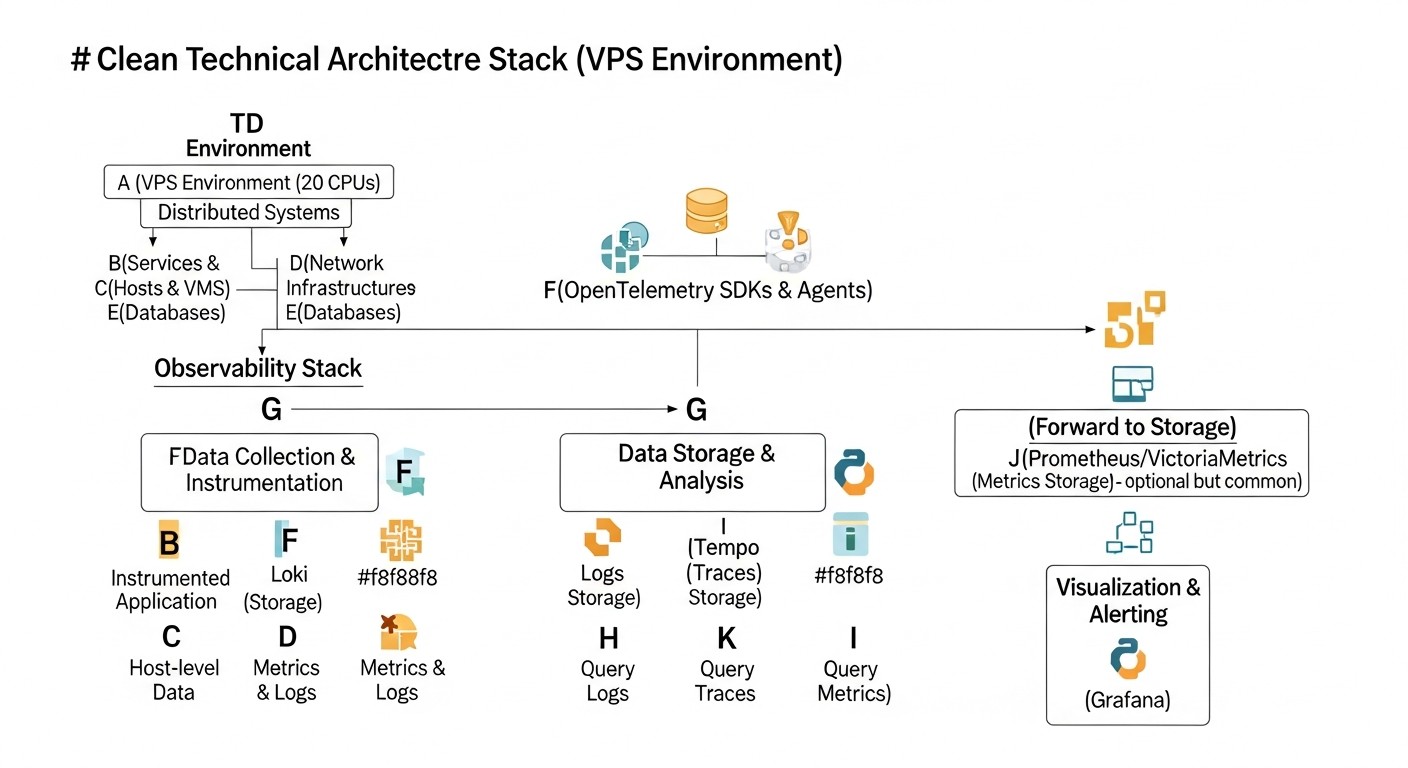 Diagram: Detailed Overview of OpenTelemetry, Loki, and Tempo
To gain a deeper understanding of why this particular combination of tools is so effective for Observability on a VPS in 2026, let's examine each component in more detail.
OpenTelemetry: Universal Telemetry Collector
OpenTelemetry (OTel for short) is not just a tool; it's a set of standards, APIs, SDKs, and tools designed for the unified collection, processing, and export of telemetry (metrics, logs, and traces) from your applications and infrastructure. By 2026, OTel has become the de facto industry standard, supported by virtually all major cloud providers and Observability tools.
Pros:
- Vendor-agnostic: You are not tied to a specific vendor or platform. You can collect data once and send it to Loki, Tempo, Prometheus, as well as any commercial solutions that support OTel. This provides immense flexibility and future-proofs your investments.
- Unified Approach: OTel provides a single API and SDK for all three types of telemetry, which significantly simplifies application instrumentation. Developers do not need to learn different libraries for metrics, logs, and traces.
- Powerful Collector: The OpenTelemetry Collector is a proxy that can receive, process, and export telemetry. It allows you to filter, transform, and aggregate data directly at the network edge, reducing the load on backends and saving traffic. This is critically important for VPS, where every megabyte of traffic and every CPU cycle counts.
- Broad Language Support: OTel has SDKs for most popular programming languages (Python, Java, Go, Node.js, .NET, PHP, Ruby, etc.), making it applicable in virtually any environment.
- Active Community and Development: The project is under the auspices of the Cloud Native Computing Foundation (CNCF) and is actively developing, constantly adding new features and improving performance.
Cons:
- Learning Curve: Despite the unification, mastering all OTel concepts (tracers, spans, contexts, resources, attributes, semantic conventions) can take some time.
- Overhead: Application instrumentation and Collector operation require some CPU and RAM consumption, albeit optimized. On very small VPS (< 1GB RAM), this can be noticeable.
Who it's for: For anyone who wants to create a flexible, scalable, and vendor-agnostic Observability system. Especially useful for microservice architectures where it is necessary to monitor interactions between many components.
Use Cases: Instrumenting HTTP requests in a Go application, collecting metrics from a Node.js service, sending custom logs from a Python script. The Collector can be configured to aggregate metrics from multiple services before sending them to Prometheus, or to sample traces to reduce the volume of data sent to Tempo.
Loki: Economical Log Storage
Loki, developed by Grafana Labs, is positioned as "Prometheus for logs." Its key difference from traditional log management systems (like Elastic Stack) is that it indexes only log metadata (labels), not their full content. This significantly reduces the index size and, consequently, disk space and RAM requirements.
Pros:
- Resource Efficiency: By indexing only metadata, Loki consumes significantly less RAM and CPU compared to solutions using full-text search. This makes it ideal for VPS environments where resources are limited.
- Object Storage: Loki can use S3-compatible object storage (such as MinIO on the same VPS, or cloud S3/Google Cloud Storage/Azure Blob Storage) to store the logs themselves. This ensures high scalability and low storage costs.
- Query Language (LogQL): Loki uses a query language inspired by PromQL, which simplifies its adoption for those already familiar with Prometheus. LogQL is very powerful and allows filtering, aggregating, and analyzing logs by their labels and content.
- Native Grafana Integration: Loki was developed by the same team as Grafana, so the integration between them is seamless. You can easily create dashboards, explore logs, and pivot from metrics to logs within a single interface.
- Ease of Deployment: Loki is relatively easy to deploy, especially in "monolithic" (single binary) mode for small installations on a VPS.
Cons:
- No Full-Text Search: If you need high-performance full-text search across all logs without prior knowledge of labels, Loki might not be the best choice. However, by 2026, with the development of OpenTelemetry and the standardization of attributes, this drawback becomes less critical.
- Dependency on Labels: Query efficiency heavily depends on the correct selection and use of labels. An incorrect labeling strategy can lead to slow queries or "high cardinality."
Who it's for: For teams that want to efficiently manage large volumes of logs on limited resources, using Grafana for visualization. Ideal for SaaS projects where logging is critical but the budget is constrained.
Use Cases: Collecting Nginx web server logs, Go microservice logs, Docker container logs, system logs. Using Promtail (Loki's agent) or OpenTelemetry Collector to send logs to Loki.
Tempo: Distributed Tracing Without the Headache
Tempo is another project from Grafana Labs, designed for storing and querying distributed traces. Its uniqueness lies in the fact that it does not build indexes over the entire content of traces. Instead, it stores traces in S3-compatible object storage and indexes only their IDs. Queries to Tempo are performed by trace ID, making it extremely efficient and resource-independent.
Pros:
- Minimal Resource Requirements: Since Tempo does not index the content of traces, it consumes very little RAM and CPU. This allows it to be deployed even on the most modest VPS.
- Scalability via Object Storage: Similar to Loki, Tempo uses S3-compatible storage for the traces themselves. This provides virtually unlimited scalability and low data storage costs.
- "Store Everything" Approach: Due to low storage costs and minimal resource requirements, Tempo allows you to store 100% of your traces, rather than relying on sampling. This enables deep analysis of even rare issues.
- Native Grafana and Prometheus Integration: Tempo easily integrates with Grafana, allowing you to pivot from metrics (Prometheus) or logs (Loki) to specific traces. Trace search by attributes is also supported via Loki or Prometheus.
- Ease of Deployment: Tempo, like Loki, can be run in "monolithic" mode for simple installations, which simplifies its deployment on a VPS.
Cons:
- Search by ID only or indirectly: The primary way to search for traces is by their unique ID. Searching by attributes (e.g., by username or order ID) is possible but requires integration with Loki (to search logs containing these attributes and the trace ID) or Prometheus (to search metrics aggregating attributes and the trace ID).
- No Built-in UI: Tempo does not have its own user interface, relying entirely on Grafana for visualizing and exploring traces.
Who it's for: For teams that require full visibility into microservice interactions but are constrained by budget and resources. Ideal for diagnosing performance, identifying bottlenecks, and understanding data flow in distributed systems.
Use Cases: Tracking the full path of a request through an API Gateway, multiple backend services, and a database. Diagnosing delays caused by external API calls. Using OpenTelemetry SDK in applications to generate traces and send them via the OpenTelemetry Collector to Tempo.
Together, OpenTelemetry, Loki, and Tempo, integrated with Grafana, provide a powerful, economical, and scalable Observability solution that is ideally suited for distributed systems deployed on a VPS in 2026.
Practical Tips and Recommendations for Implementation
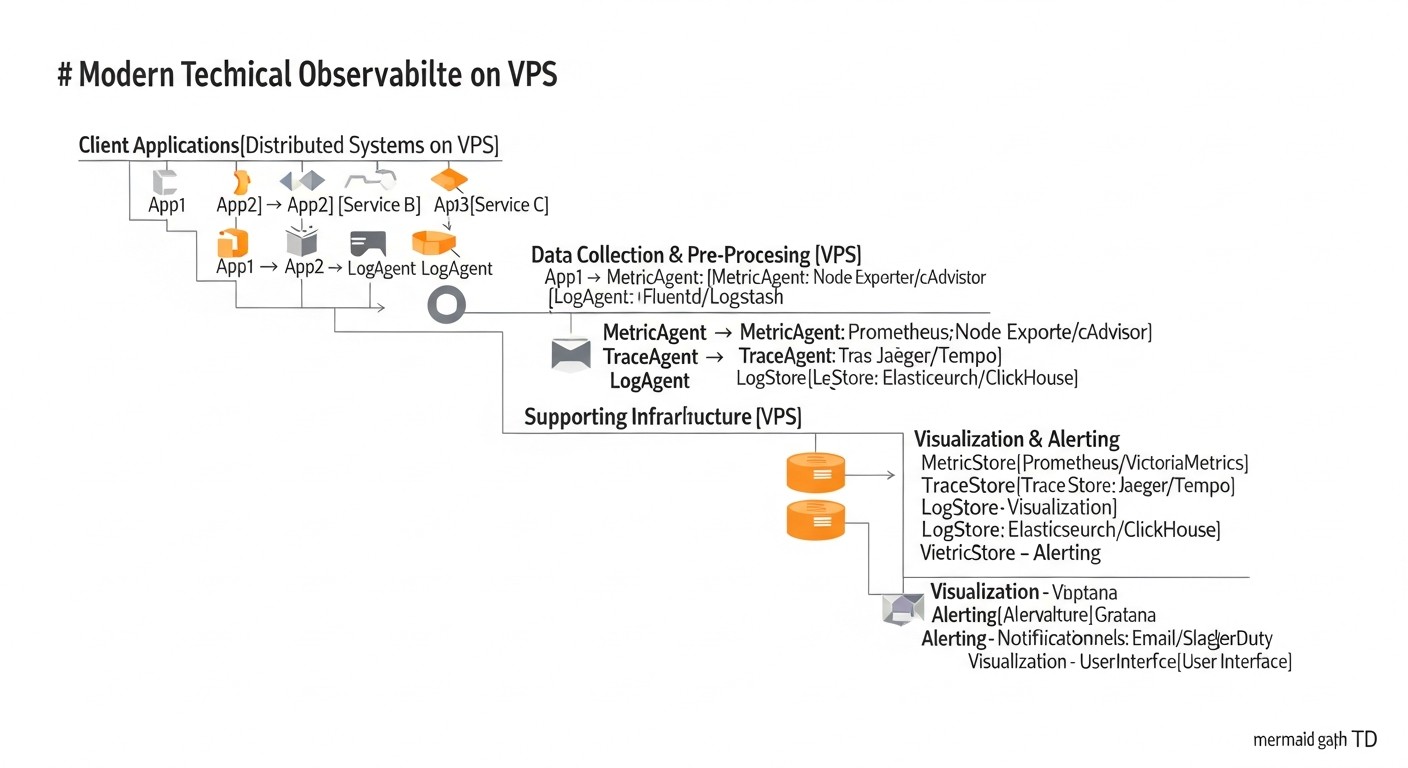 Diagram: Practical Tips and Recommendations for Implementation
Implementing a full-fledged Observability system on a VPS requires not only an understanding of the tools but also a practical approach. Here are step-by-step instructions and recommendations based on real-world experience.
1. VPS Preparation and Basic Setup
Before installing anything, make sure your VPS is ready. It is recommended to use a fresh installation of Ubuntu Server 24.04 LTS or Debian 12. For our purposes, a minimum of 4GB RAM and 2 CPU cores will be required, as well as sufficient disk space or the ability to connect S3-compatible storage.
# System update
sudo apt update && sudo apt upgrade -y

# Install Docker and Docker Compose (for simplified deployment)
sudo apt install ca-certificates curl gnupg lsb-release -y
sudo mkdir -p /etc/apt/keyrings
curl -fsSL https://download.docker.com/linux/ubuntu/gpg | sudo gpg --dearmor -o /etc/apt/keyrings/docker.gpg
echo "deb [arch=$(dpkg --print-architecture) signed-by=/etc/apt/keyrings/docker.gpg] https://download.docker.com/linux/ubuntu $(lsb_release -cs) stable" | sudo tee /etc/apt/sources.list.d/docker.list > /dev/null
sudo apt update
sudo apt install docker-ce docker-ce-cli containerd.io docker-compose-plugin -y

# Add user to docker group
sudo usermod -aG docker $USER
# Log out and log back in for changes to take effect, or run:
# newgrp docker

# Install MinIO (local S3-compatible storage for Loki and Tempo)
# Create directories for MinIO data and configuration
sudo mkdir -p /mnt/data/minio
sudo mkdir -p /etc/minio
# Create docker-compose.yml file for MinIO
# nano docker-compose.yml
Example docker-compose.yml for MinIO:
version: '3.8'
services:
  minio:
    image: minio/minio:latest
    container_name: minio
    ports:
      - "9000:9000"
      - "9001:9001"
    volumes:
      - /mnt/data/minio:/data
      - /etc/minio:/root/.minio
    environment:
      MINIO_ROOT_USER: minioadmin
      MINIO_ROOT_PASSWORD: minioadminpassword
      MINIO_BROWSER: "on"
    command: server /data --console-address ":9001"
    healthcheck:
      test: ["CMD", "curl", "-f", "http://localhost:9000/minio/health/live"]
      interval: 30s
      timeout: 20s
      retries: 3
    restart: unless-stopped
# Start MinIO
docker compose up -d
MinIO is now available at http://<your_ip>:9001. Create buckets for Loki and Tempo, for example, loki-bucket and tempo-bucket.
2. Deploying OpenTelemetry Collector
The Collector will be the central node for collecting, processing, and routing telemetry. For a VPS, it can be deployed as a Docker container.
Example otel-collector-config.yaml:
receivers:
  otlp:
    protocols:
      grpc:
      http:

processors:
  batch:
    send_batch_size: 1000
    timeout: 10s
  memory_limiter:
    check_interval: 1s
    limit_mib: 256 # RAM limit for Collector
    spike_limit_mib: 64
  resource:
    attributes:
      - key: host.name
        value: ${env:HOSTNAME}
        action: upsert
      - key: deployment.environment
        value: production
        action: insert

exporters:
  loki:
    endpoint: http://loki:3100/loki/api/v1/push
    # auth:
    #   basic:
    #     username: ${env:LOKI_USERNAME}
    #     password: ${env:LOKI_PASSWORD}
  tempo:
    endpoint: http://tempo:4317
    tls:
      insecure: true # Use TLS in production
  prometheus:
    endpoint: 0.0.0.0:8889
    resource_to_telemetry_conversion:
      enabled: true
  logging:
    loglevel: debug

service:
  pipelines:
    traces:
      receivers: [otlp]
      processors: [memory_limiter, batch, resource]
      exporters: [tempo, logging]
    metrics:
      receivers: [otlp]
      processors: [memory_limiter, batch, resource]
      exporters: [prometheus, logging]
    logs:
      receivers: [otlp]
      processors: [memory_limiter, batch, resource]
      exporters: [loki, logging]
Starting the Collector via docker-compose.yml:
version: '3.8'
services:
  otel-collector:
    image: otel/opentelemetry-collector:0.96.0 # Current version for 2026
    container_name: otel-collector
    command: ["--config=/etc/otel-collector-config.yaml"]
    volumes:
      - ./otel-collector-config.yaml:/etc/otel-collector-config.yaml
    ports:
      - "4317:4317" # OTLP gRPC receiver
      - "4318:4318" # OTLP HTTP receiver
      - "8889:8889" # Prometheus exporter
    environment:
      HOSTNAME: ${HOSTNAME} # Pass hostname
    depends_on:
      - loki
      - tempo
    restart: unless-stopped
3. Deploying Loki
We also use Docker for Loki. We will need the loki-config.yaml configuration file.
auth_enabled: false # For simplicity, use authentication in production

server:
  http_listen_port: 3100
  grpc_listen_port: 9095

common:
  path_prefix: /loki
  storage:
    filesystem:
      directory: /tmp/loki/chunks # For temporary storage only, then to S3
  replication_factor: 1
  ring:
    kvstore:
      store: inmemory # For single-node, use Consul/Etcd in production
    instance_addr: 127.0.0.1
    instance_port: 3100

schema_config:
  configs:
    - from: 2023-01-01
      store: boltdb-shipper
      object_store: s3
      schema: v12
      index:
        prefix: index_
        period: 24h

compactor:
  working_directory: /tmp/loki/compactor
  shared_store: s3

chunk_store_config:
  max_look_back_period: 30d # Store log chunks for 30 days

storage_config:
  boltdb_shipper:
    active_index_directory: /tmp/loki/boltdb-shipper-active
    cache_location: /tmp/loki/boltdb-shipper-cache
    resync_interval: 5s
    shared_store: s3
  s3:
    endpoint: minio:9000
    bucketnames: loki-bucket
    access_key_id: minioadmin
    secret_access_key: minioadminpassword
    s3forcepathstyle: true
Adding Loki to docker-compose.yml:
  loki:
    image: grafana/loki:2.9.0 # Current version for 2026
    container_name: loki
    command: -config.file=/etc/loki/loki-config.yaml
    volumes:
      - ./loki-config.yaml:/etc/loki/loki-config.yaml
      - /mnt/data/loki:/tmp/loki # Loki data
    ports:
      - "3100:3100"
    environment:
      MINIO_ENDPOINT: minio:9000 # For Loki to be able to reach MinIO
    depends_on:
      - minio
    restart: unless-stopped
4. Deploying Tempo
Tempo configuration in tempo-config.yaml:
server:
  http_listen_port: 3200
  grpc_listen_port: 9096

distributor:
  receivers:
    otlp:
      protocols:
        grpc:
        http:

ingester:
  lifecycler:
    ring:
      kvstore:
        store: inmemory # For single-node, use Consul/Etcd in production
      replication_factor: 1

compactor:
  compaction_interval: 10m

storage:
  trace:
    backend: s3
    s3:
      endpoint: minio:9000
      bucket: tempo-bucket
      access_key_id: minioadmin
      secret_access_key: minioadminpassword
      s3forcepathstyle: true
    wal:
      path: /tmp/tempo/wal # Write Ahead Log
    block:
      bloom_filter_false_positive_rate: 0.05
      index_downsample_bytes: 1000
      max_block_bytes: 5000000 # 5MB
      max_block_duration: 15m
    retention: 30d # Store traces for 30 days
Adding Tempo to docker-compose.yml:
  tempo:
    image: grafana/tempo:2.4.0 # Current version for 2026
    container_name: tempo
    command: -config.file=/etc/tempo/tempo-config.yaml
    volumes:
      - ./tempo-config.yaml:/etc/tempo/tempo-config.yaml
      - /mnt/data/tempo:/tmp/tempo # Tempo data
    ports:
      - "3200:3200" # HTTP
      - "9096:9096" # gRPC
      - "4317" # OTLP gRPC receiver (Tempo can receive directly, but it's better via Collector)
      - "4318" # OTLP HTTP receiver
    environment:
      MINIO_ENDPOINT: minio:9000 # For Tempo to be able to reach MinIO
    depends_on:
      - minio
    restart: unless-stopped
5. Deploying Grafana
Grafana will be your unified interface for all Observability data.
  grafana:
    image: grafana/grafana:10.4.0 # Current version for 2026
    container_name: grafana
    ports:
      - "3000:3000"
    volumes:
      - /mnt/data/grafana:/var/lib/grafana # For Grafana data persistence
    environment:
      GF_SECURITY_ADMIN_USER: admin
      GF_SECURITY_ADMIN_PASSWORD: supersecretpassword # Change to a strong password!
      GF_AUTH_ANONYMOUS_ENABLED: "false"
      GF_AUTH_DISABLE_SIGNOUT_MENU: "false"
    depends_on:
      - loki
      - tempo
      - otel-collector
    restart: unless-stopped
# Start all services
docker compose up -d
Grafana is now available at http://<your_ip>:3000. Log in with username admin and password supersecretpassword.
6. Configuring Data Sources in Grafana
- Add Loki as a data source:
- Type: Loki
- URL:
http://loki:3100
- Add Tempo as a data source:
- Type: Tempo
- URL:
http://tempo:3200
- For "Data Links", specify Loki as the source to enable navigation from traces to logs.
- Add Prometheus (OpenTelemetry Collector) as a data source:
- Type: Prometheus
- URL:
http://otel-collector:8889
7. Application Instrumentation
The most important step is to instrument your applications using the OpenTelemetry SDK. Example for Python:
import os
from opentelemetry import trace
from opentelemetry.exporter.otlp.proto.grpc.trace_exporter import OTLPSpanExporter
from opentelemetry.instrumentation.flask import FlaskInstrumentor
from opentelemetry.sdk.resources import Resource
from opentelemetry.sdk.trace import TracerProvider
from opentelemetry.sdk.trace.export import BatchSpanProcessor
from flask import Flask

# OpenTelemetry Setup
resource = Resource.create({
    "service.name": "my-python-app",
    "service.version": "1.0.0",
    "deployment.environment": "production",
    "host.name": os.getenv("HOSTNAME", "unknown_host")
})

trace.set_tracer_provider(TracerProvider(resource=resource))
tracer = trace.get_tracer(__name__)

# Exporting traces to OpenTelemetry Collector
otlp_exporter = OTLPSpanExporter(endpoint="http://otel-collector:4317", insecure=True)
span_processor = BatchSpanProcessor(otlp_exporter)
trace.get_tracer_provider().add_span_processor(span_processor)

app = Flask(__name__)
FlaskInstrumentor().instrument_app(app)

@app.route('/')
def hello():
    with tracer.start_as_current_span("hello-request"):
        return "Hello, Observability!"

if __name__ == '__main__':
    app.run(host='0.0.0.0', port=5000)
Similar SDKs are available for all popular languages. Use them to generate metrics, logs, and traces, sending them to the OpenTelemetry Collector on ports 4317 (gRPC) or 4318 (HTTP).
8. Deployment Automation
In 2026, manual deployment is an anachronism. Use Ansible, Terraform, or other IaC (Infrastructure as Code) tools to automate the installation and configuration of the VPS, Docker, and all Observability components. This will significantly reduce deployment time and minimize the likelihood of errors.
9. Monitoring the Observability System Itself
Don't forget to monitor Loki, Tempo, and the OpenTelemetry Collector. Use their own metrics (which can be collected by Prometheus) to track their performance, resource consumption, and the volume of data processed. This will help identify bottlenecks before they become critical.
Typical Mistakes When Building Observability on a VPS
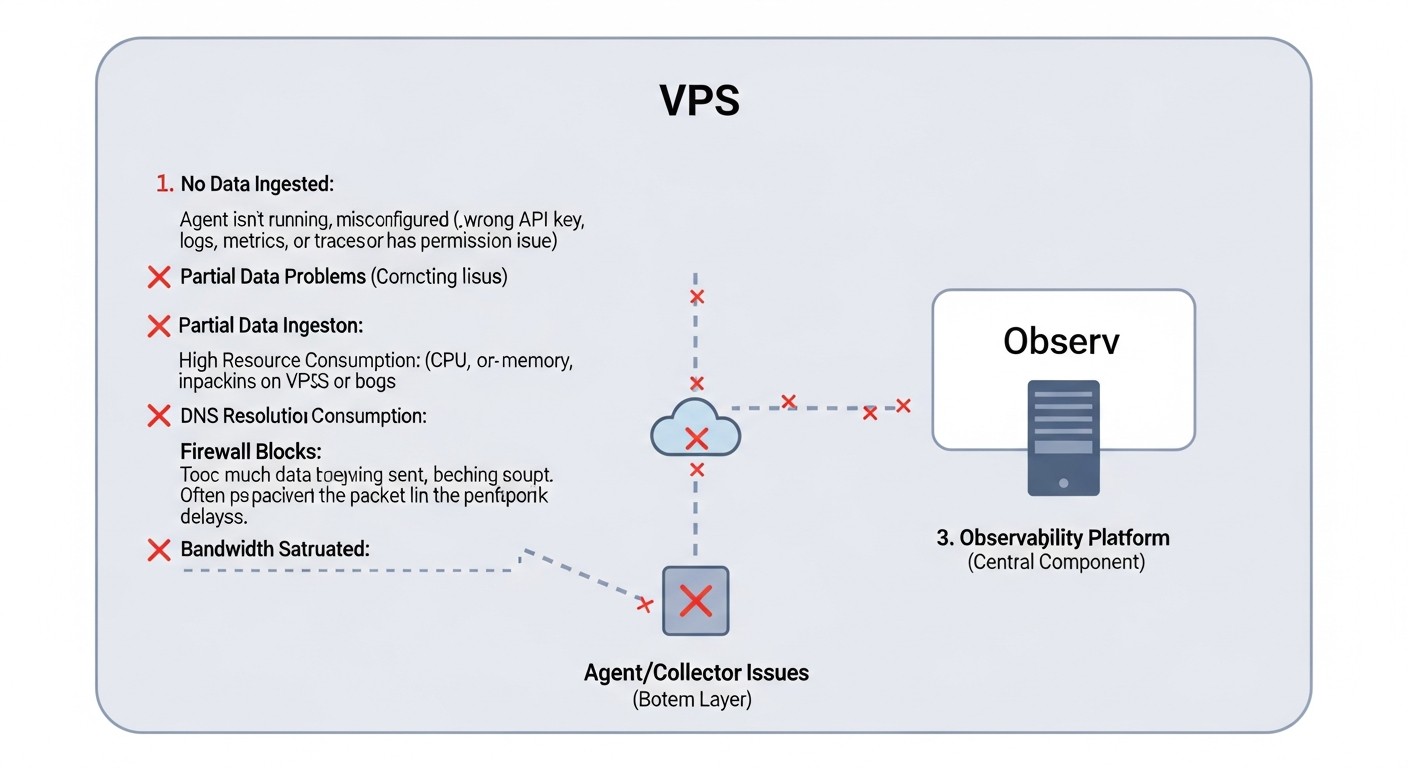 Diagram: Typical Mistakes When Building Observability on a VPS
Even with the best tools, implementation errors can negate all efforts. Here are the most common misconceptions and pitfalls when building an Observability system on a VPS, relevant for 2026.
1. Ignoring OpenTelemetry Collector as a Proxy
Mistake: Sending telemetry directly from applications to Loki, Tempo, or Prometheus without using OpenTelemetry Collector. Or using the Collector, but without effective processors (e.g., batching, filtering, sampling).
How to avoid: Always use OpenTelemetry Collector as a central hub. It is designed to be a buffer, proxy, and processor. Configure it for batching (combining data into packets), filtering unnecessary data, aggregating metrics, and sampling traces (especially for high-load systems). This significantly reduces the load on backends (Loki, Tempo) and saves traffic, which is critical for a VPS.
Real-world consequence example: A service with a high request frequency generates a huge number of short traces. If sent directly to Tempo, each "span" will be a separate HTTP request, leading to network and Tempo ingester overload, quickly exhausting VPS resources and exceeding traffic limits.
2. Incorrect Use of Labels in Loki (High Cardinality)
Mistake: Using high-cardinality data (e.g., unique session IDs, user IDs, full URL paths with parameters) as labels for logs in Loki. This leads to index bloat and slow queries.
How to avoid: Labels in Loki should be low-cardinality (e.g., service name, version, host, log level, HTTP method, status code). High-cardinality data should be left in the log body, where it can be searched using regular expressions but not indexed. In 2026, with the development of LogQL and the ability to parse logs on the fly, this becomes even more relevant.
Real-world consequence example: A developer adds user_id as a label to each log. If you have 100,000 active users, this will create 100,000 unique label combinations, significantly increasing Loki's index size, slowing down all queries, and quickly filling up disk space, even when using object storage.
3. Lack of Trace Sampling for High-Load Systems
Mistake: Attempting to collect 100% of traces from all services in a high-load distributed system running on a VPS.
How to avoid: For production systems on a VPS, it is essential to configure trace sampling in OpenTelemetry Collector. You can use Head-based sampling (the sampling decision is made at the beginning of the trace) or Tail-based sampling (the decision is made after the trace completes, allowing sampling based on errors or duration). Typical strategies: sample 1 out of 1000 requests, but 100% of requests with errors or requests exceeding a certain latency threshold. Tempo is designed to store 100% of traces, but if you have a very large volume, sampling on the Collector may be necessary to save resources and traffic.
Real-world consequence example: 100% sampling on a service processing 1000 requests per second will lead to the generation of tens of thousands of spans per second. This will quickly overload the Collector, clog the queue for sending to Tempo, and likely exceed write limits to object storage, leading to data loss and instability of the entire Observability system.
4. Underestimating Data Storage and Traffic Costs
Mistake: Assuming that object storage (even S3-compatible on a VPS) or cloud S3 will be "free" or very cheap with large data volumes. Ignoring the cost of egress traffic.
How to avoid: Always plan for the data volumes your applications will generate. Forecast growth and regularly review the retention policy for Loki and Tempo. Use OpenTelemetry Collector for preliminary data filtering and aggregation to send only the most important data. If using cloud S3, be especially mindful of egress traffic costs when querying data from Loki/Tempo on your VPS. Hosting MinIO on the same VPS as Loki/Tempo eliminates traffic costs between them.
Real-world consequence example: A project launches with a 30-day log and trace retention period. After a few months, data volume grows to terabytes, and the monthly bill for storage and, more critically, for S3 queries from Loki/Tempo on the VPS (egress traffic), becomes unmanageable, exceeding the cost of the VPS itself.
5. Lack of Monitoring for the Observability System Itself
Mistake: Deploying Loki, Tempo, OpenTelemetry Collector and failing to monitor their own health and performance.
How to avoid: Treat your Observability system as any other critical service. Collect metrics from Loki (/metrics), Tempo (/metrics), and OpenTelemetry Collector (/metrics). Add them to your Prometheus exporter (which in our case is part of the Collector). Create Grafana dashboards to monitor their CPU, RAM, disk space, amount of data processed, and write/read latencies. Configure alerts for critical thresholds.
Real-world consequence example: Loki starts indexing logs slowly due to insufficient RAM, but no one notices. After a few days, log queries become impossible, and new logs stop being written, rendering diagnosis of any issues with the main application blind.
6. Insufficient or Excessive Instrumentation
Mistake: Either application instrumentation is too superficial (not enough data for diagnosis), or it is excessive (too much irrelevant telemetry is generated).
How to avoid: Start with basic instrumentation: HTTP requests (incoming/outgoing), database calls, critical business operations. Gradually add more detailed telemetry as bottlenecks are identified or new requirements emerge. Use OpenTelemetry semantic conventions to standardize metric names, spans, and attributes. Educate developers on what data is important and what is not. In 2026, as AI assistants can help with analysis, the quality and consistency of instrumentation become even more crucial.
Real-world consequence example:
- Insufficient: An error occurs in the application, but logs only contain "Internal Server Error," and traces cut off midway, providing no context, leading to hours of problem-solving.
- Excessive: Every call to an internal cache generates a new span, even though it's not a critical operation. This leads to trace bloat, increased data volume, and difficulty in reading.
7. Ignoring Security
Mistake: Lack of authentication and authorization for access to Loki, Tempo, Grafana, MinIO. Transmitting sensitive data in logs or traces without masking.
How to avoid: Always configure authentication (e.g., basic HTTP authentication for MinIO, Grafana, Loki) and use TLS to encrypt traffic between components. OpenTelemetry Collector has processors for masking sensitive data. Regularly audit what data enters your Observability system.
Real-world consequence example: Loki or Tempo configuration is accessible without a password. An attacker gains access to logs and traces containing personal user data or confidential business information, leading to data breaches and serious reputational and legal issues.
Checklist for Practical Application
This checklist will help you consistently implement and maintain an Observability system based on OpenTelemetry, Loki, and Tempo on your VPS in 2026.
- VPS Resource Planning:
- [ ] VPS selected with sufficient RAM (minimum 4GB), CPU (minimum 2 cores), and disk space (start with 100GB, plan for growth).
- [ ] S3-compatible storage provider identified or space allocated for local MinIO on the VPS.
- [ ] Log and trace volumes forecasted, estimated storage and traffic costs calculated.
- Basic VPS Setup:
- [ ] VPS updated and secured (firewall, SSH keys).
- [ ] Docker and Docker Compose installed (or Kubernetes, if applicable).
- [ ] Directories created for persistent data of MinIO, Loki, Tempo, Grafana.
- MinIO Deployment (or S3 Connection):
- [ ] MinIO started and accessible (or credentials configured for cloud S3).
- [ ] Separate buckets created for Loki (e.g.,
loki-bucket) and Tempo (e.g., tempo-bucket).
- [ ] Credentials configured for MinIO/S3 access.
- OpenTelemetry Collector Deployment:
- [ ] Collector deployed as a Docker container.
- [ ]
otel-collector-config.yaml configured for OTLP reception.
- [ ] Processors configured:
batch, memory_limiter, resource (with hostname, environment added).
- [ ] Exporters configured for Loki, Tempo, and Prometheus (for Collector metrics).
- [ ] Collector configured to send logs to Loki, traces to Tempo, and metrics to Prometheus.
- Loki Deployment:
- [ ] Loki deployed as a Docker container.
- [ ]
loki-config.yaml configured to use S3-compatible storage (MinIO).
- [ ] Reasonable retention policy set (
chunk_store_config.max_look_back_period, schema_config.configs.period).
- [ ] Authentication configured if Loki is externally accessible (in production).
- Tempo Deployment:
- [ ] Tempo deployed as a Docker container.
- [ ]
tempo-config.yaml configured to use S3-compatible storage (MinIO).
- [ ] Reasonable retention policy set (
storage.trace.retention).
- [ ] Authentication configured if Tempo is externally accessible (in production).
- Grafana Deployment:
- [ ] Grafana deployed as a Docker container.
- [ ] Strong password set for Grafana administrator.
- [ ] Data sources added: Loki (
http://loki:3100), Tempo (http://tempo:3200), Prometheus (http://otel-collector:8889).
- [ ] In Tempo data source, connection to Loki configured for log lookup by traces.
- Application Instrumentation:
- [ ] Applications instrumented using OpenTelemetry SDK.
- [ ] Metrics, logs, and traces configured to be sent to OpenTelemetry Collector (
http://otel-collector:4317 or 4318).
- [ ] OpenTelemetry semantic conventions used for names and attributes.
- [ ] Trace sampling implemented for high-load services.
- [ ] Verified that sensitive data does not enter telemetry without masking.
- Dashboard and Alert Creation:
- [ ] Basic Grafana dashboards created for monitoring key application metrics, logs, and traces.
- [ ] Alerts configured for critical events and performance thresholds.
- [ ] Dashboards created for monitoring the Observability system itself (Loki, Tempo, Collector).
- Automation and Maintenance:
- [ ] Deployment of all components automated using IaC (Ansible, Terraform).
- [ ] Automatic backup of important configuration files configured.
- [ ] Plan developed for regular updates of Observability components.
- [ ] Storage and traffic cost assessment and optimization performed.
Cost Calculation / Observability Economics on VPS
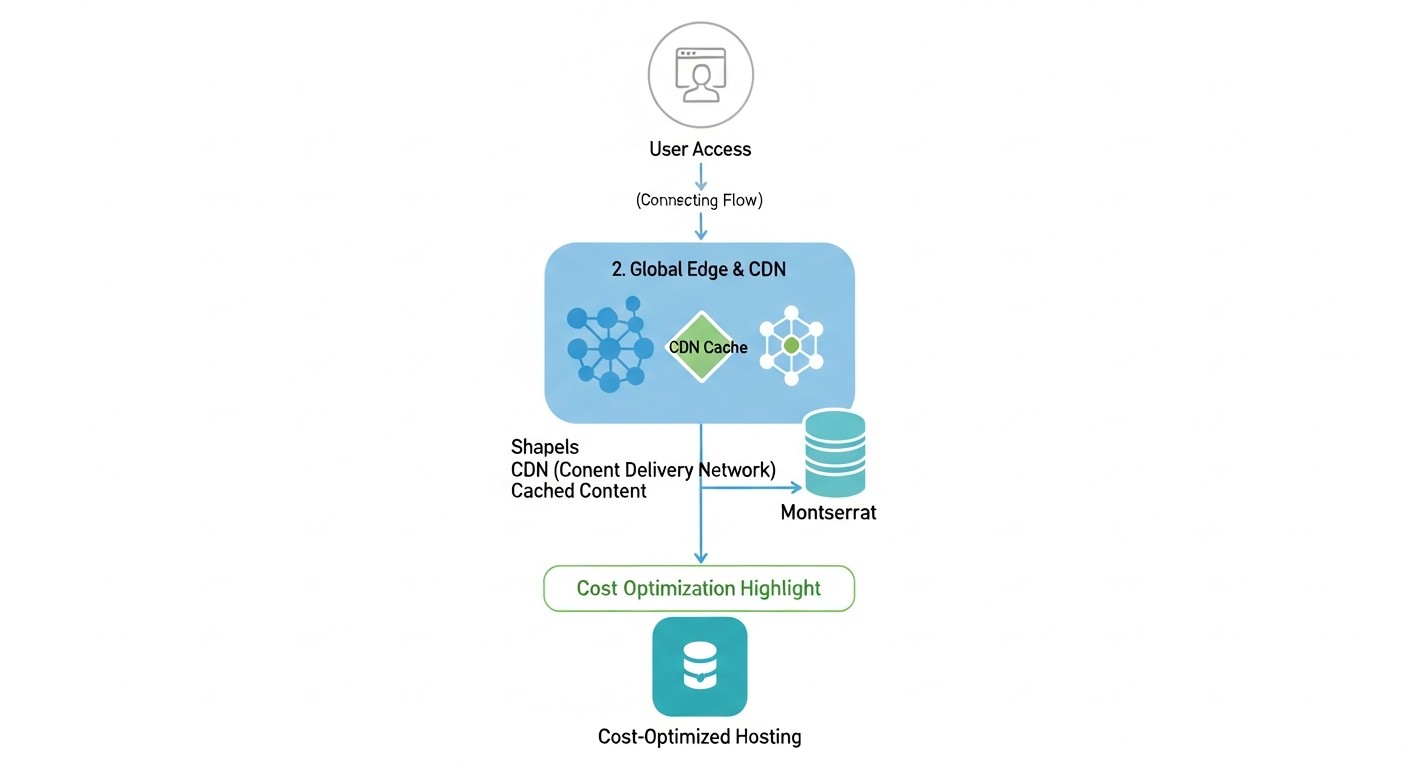 Diagram: Cost Calculation / Observability Economics on VPS
Observability economics on VPS in 2026 involves not only direct server costs but also carefully planned expenses for data storage, traffic, and, no less importantly, engineer time. The right choice of the OpenTelemetry, Loki, and Tempo stack allows for significant optimization of these costs.
Main Cost Categories for VPS in 2026:
- VPS Instance: CPU, RAM, basic disk subsystem.
- Data Storage: For logs (Loki), traces (Tempo), and metrics (Prometheus). Can be local on the VPS or external (S3-compatible object storage).
- Traffic: Inbound (from applications to Collector) and outbound (from Collector to backends, from Loki/Tempo to Grafana, from Grafana to users, and also between VPS and S3 storage if it's external).
- Engineer Time: Setup, support, optimization, troubleshooting.
Example Calculations for Different Scenarios (illustrative, 2026 prices):
Assume the average VPS cost in 2026:
- Small VPS (2 CPU, 4GB RAM, 100GB SSD): 15-25 USD/month
- Medium VPS (4 CPU, 8GB RAM, 200GB SSD): 30-50 USD/month
- Object Storage (S3-compatible): 0.01-0.02 USD/GB/month
- Outbound Traffic: 0.05-0.10 USD/GB
Scenario 1: Small Startup (1-3 microservices, ~500 RPS)
- VPS: 1x Medium VPS (4 CPU, 8GB RAM, 200GB SSD) for all components (OpenTelemetry Collector, Loki, Tempo, Grafana, MinIO).
- Data Volume:
- Logs: 50 GB/month (30-day retention)
- Traces: 20 GB/month (30-day retention, 1:100 sampling)
- Metrics: 5 GB/month
- Storage (MinIO on the same VPS):
- Disk Space: 50 GB (Loki) + 20 GB (Tempo) + 5 GB (Prometheus) + 10 GB (Grafana, OS) = ~85 GB. This fits within the 200GB SSD VPS.
- Cost: Included in VPS.
- Traffic:
- Inbound (from applications to Collector): 100 GB/month
- Outbound (from Collector to Loki/Tempo/Prometheus, internal): 0 USD (within VPS).
- Outbound (from Grafana to users): 20 GB/month
- Total Paid Traffic: ~120 GB/month.
- Traffic Cost: 120 GB * 0.07 USD/GB = 8.4 USD/month.
- Total Estimated Cost: 40 USD (VPS) + 8.4 USD (traffic) = ~48.4 USD/month.
Scenario 2: Growing SaaS Project (5-10 microservices, ~5000 RPS)
- VPS:
- 1x Medium VPS (4 CPU, 8GB RAM, 200GB SSD) for OpenTelemetry Collector, Prometheus, Grafana. (~40 USD/month)
- 1x Small VPS (2 CPU, 4GB RAM, 100GB SSD) for Loki and Tempo (load separation). (~20 USD/month)
- Data Volume:
- Logs: 500 GB/month (30-day retention)
- Traces: 200 GB/month (30-day retention, 1:50 sampling)
- Metrics: 50 GB/month
- Storage (Cloud S3):
- Total Volume: 500 GB (Loki) + 200 GB (Tempo) = 700 GB.
- S3 Cost: 700 GB * 0.015 USD/GB = 10.5 USD/month.
- Traffic:
- Inbound (from applications to Collector): 1 TB/month
- Outbound (from Collector to Loki/Tempo/Prometheus): 1 TB/month (partially internal, partially to S3).
- Outbound (from Loki/Tempo to S3): 700 GB/month (write)
- Outbound (from S3 to Loki/Tempo on VPS for queries): 100 GB/month (very active queries)
- Outbound (from Grafana to users): 50 GB/month
- Total Paid Traffic (including S3): ~100 GB (S3 retrieval) + 50 GB (Grafana) + 1 TB (Collector -> S3) = ~1.15 TB/month.
- Traffic Cost: 1150 GB * 0.07 USD/GB = 80.5 USD/month.
- Total Estimated Cost: 40 USD (VPS1) + 20 USD (VPS2) + 10.5 USD (S3) + 80.5 USD (traffic) = ~151 USD/month.
Hidden Costs and How to Optimize Them:
- Outbound Traffic: This is the most insidious cost.
- Optimization: Maximize the use of OpenTelemetry Collector for filtering, aggregation, and sampling data BEFORE sending it. If possible, host S3-compatible storage on the same VPS or within the same network to minimize paid traffic.
- CPU/RAM Overhead: Inefficient queries to Loki or Tempo, too many labels, or lack of batching can quickly exhaust VPS resources.
- Optimization: Configure
memory_limiter in the Collector. Optimize LogQL and PromQL queries. Regularly analyze the metrics of the Observability stack itself to identify bottlenecks.
- Engineer Time: Manual setup, debugging, updates.
- Optimization: Invest in Infrastructure as Code (Docker Compose, Ansible). Create standardized configurations and templates. Train the team on using Observability tools.
- Long-term Storage: If you need to store data longer than 30-90 days, costs will increase.
- Optimization: Develop an archiving strategy. For very old logs and traces, you can move them to cheaper "cold" S3 classes or delete them entirely if they are not required for auditing.
Table with Example Calculations for Different Scenarios (generalized):
| Parameter |
Small Project (500 RPS) |
Medium Project (5000 RPS) |
Large Project (20000+ RPS) |
| Number of VPS |
1 (medium) |
2 (1 medium, 1 small) |
3+ (Loki/Tempo cluster) |
| VPS Cost/month |
~40 USD |
~60 USD |
~150-300 USD+ |
| Log Volume/month |
50 GB |
500 GB |
2 TB+ |
| Trace Volume/month |
20 GB |
200 GB |
800 GB+ |
| S3 Storage Cost/month |
0 USD (local) |
~10.5 USD |
~40-100 USD+ |
| Traffic Cost/month |
~8.4 USD |
~80.5 USD |
~300-600 USD+ |
| Total Cost/month |
~48.4 USD |
~151 USD |
~490-1000 USD+ |
| Recommendations |
MinIO on the same VPS, aggressive sampling/filtering |
Separate Loki/Tempo to a dedicated VPS, cloud S3, active Collector optimization |
Clustered Loki/Tempo version (e.g., on K8s), dedicated instances, multi-zone S3, deep optimization |
As can be seen, even for growing projects, the combination of OpenTelemetry, Loki, and Tempo on VPS remains significantly more economical than most commercial or fully cloud-based solutions, especially when it comes to traffic control and efficient use of object storage.
Use Cases and Examples
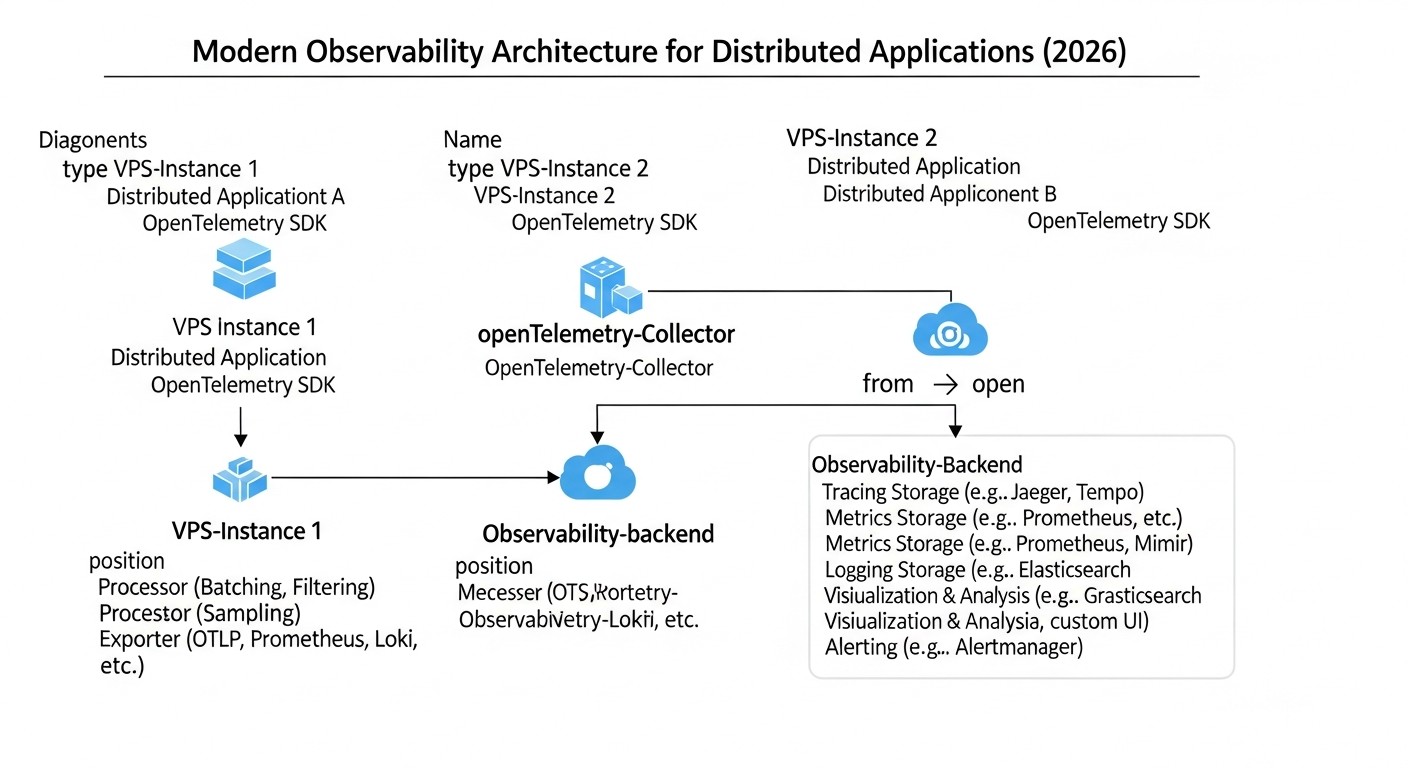 Diagram: Use Cases and Examples
Let's consider several realistic scenarios demonstrating the effectiveness of the OpenTelemetry, Loki, and Tempo combination on a VPS in 2026.
Case 1: Diagnosing Slow Requests in an E-commerce API
Problem: Users complain about random but noticeable delays when placing orders in a small online store running on 5 microservices (Go, Python) on a single medium VPS. Traditional monitoring only shows overall CPU and RAM usage but doesn't provide insight into where the delay is actually occurring.
Observability Solution:
- Instrumentation: All microservices were instrumented using the OpenTelemetry SDK. Each HTTP request, database call, external payment gateway request, and internal calls between services generate spans. Logs from each service are also sent via OpenTelemetry Collector to Loki.
- Collector Configuration: The OpenTelemetry Collector is configured to collect all traces, metrics, and logs, and then send them to Tempo, Loki, and Prometheus (for metrics). Trace sampling was enabled at 1:100, but 100% of traces with errors or durations longer than 500ms were captured.
- Grafana: Dashboards were created in Grafana showing overall API latency, error count, and resource utilization. A "Service Graph" based on traces was added, showing the interconnections between services.
- Diagnosis:
- An engineer notices a latency peak for the
/checkout endpoint on the Grafana dashboard.
- From the metrics dashboard, they navigate to traces in Tempo, using the "Trace ID" from logs or simply by clicking "Explore traces" for the given time interval.
- In Tempo, they find the trace corresponding to the slow request. The trace visualization shows that most of the delay occurs in the service
payment-gateway-service when calling an external API.
- From the external API call span, they click on "Logs" (Tempo-Loki integration) and see logs from
payment-gateway-service for that trace_id. The logs reveal a recurring timeout error message when connecting to the external payment gateway.
Result: Instead of hours of debugging and sifting through logs, the problem was localized in 15 minutes. It turned out that the external payment gateway was experiencing performance issues. The team was able to promptly contact the gateway provider and switch to a backup option, minimizing losses.
Case 2: Resource Consumption and Cost Optimization for an IoT Startup
Problem: A startup is developing a platform for monitoring IoT devices. Each device sends telemetry every 10 seconds. The number of devices is growing rapidly, and the current Elastic Stack-based system on a VPS is becoming prohibitively expensive due to the huge volume of logs and metrics, as well as high RAM/CPU requirements for Elasticsearch.
Observability Solution:
- Transition to OpenTelemetry, Loki, Tempo: A decision was made to switch to a more resource-efficient stack.
- IoT Agent Instrumentation: Agents on IoT devices are configured to send metrics and logs via OpenTelemetry Protocol (OTLP) to the OpenTelemetry Collector on the central VPS. Traces for IoT devices were deemed excessive for this task and disabled for cost savings.
- Collector Configuration: The OpenTelemetry Collector on the VPS is configured to:
- Aggregate metrics (e.g., average value over 1 minute instead of each data point).
- Filter logs: discard informational logs, retaining only warnings and errors.
- Add
device_id, device_type, location attributes to each log and metric.
- Loki and Tempo: Loki is used for storing filtered logs. Tempo is deployed but used only for traces of backend services processing data from IoT devices, not for the devices themselves. MinIO is deployed on the same VPS for storing Loki and Tempo data.
- Grafana: Dashboards display aggregated metrics by device types, locations, as well as warnings and errors, filtered by the same attributes.
Result:
- Reduced VPS Costs: RAM/CPU requirements for Loki were 3-5 times lower than for Elasticsearch, allowing for the use of a cheaper VPS.
- Storage Savings: Thanks to log filtering and indexing only metadata in Loki, the volume of stored logs was reduced by 70%, and the cost of data storage in MinIO was significantly lower than with Elastic.
- Traffic Control: Aggregation and filtering in the Collector reduced incoming traffic volume by 50%, which directly impacted VPS provider bills.
- Improved Diagnostics: Despite aggregation, important metrics and errors became easier to find thanks to proper labeling and efficient queries in Grafana.
These cases demonstrate how OpenTelemetry, Loki, and Tempo can be effectively used to solve real business problems, providing deep observability while maintaining control over VPS expenses.
Troubleshooting (troubleshooting)
 Diagram: Troubleshooting (troubleshooting)
Even with the most careful configuration, problems may arise during the operation of an Observability system. Below are typical issues and methods for their diagnosis and resolution for OpenTelemetry, Loki, and Tempo on a VPS.
1. No data in Grafana (metrics, logs, traces)
Possible causes:
- The application is not sending data to the Collector.
- The Collector is not receiving data or cannot export it.
- Loki/Tempo is not receiving data from the Collector or cannot write it to storage.
- Grafana cannot connect to Loki/Tempo/Collector.
- Network/firewall issues.
Diagnostic commands and steps:
- Check application logs: Ensure that the OpenTelemetry SDK is initialized and not throwing errors when sending data. Verify that the Collector endpoint is specified correctly (e.g.,
http://otel-collector:4317).
- Check OpenTelemetry Collector logs:
docker logs otel-collector
# Or if Collector runs as a systemd service
sudo journalctl -u otel-collector -f
Look for connection errors to Loki/Tempo, data parsing errors, or buffer overflow messages. Ensure that the Collector is listening on the correct ports.
sudo netstat -tulnp | grep 4317 # Check if Collector is listening on OTLP gRPC port
sudo netstat -tulnp | grep 4318 # Check if Collector is listening on OTLP HTTP port
- Check Loki and Tempo logs:
docker logs loki
docker logs tempo
Look for errors writing to S3/MinIO, authentication errors, or disk space issues. Ensure that Loki and Tempo are listening on their respective ports (3100 and 3200).
- Check Grafana connection: In Grafana, go to "Configuration" -> "Data Sources". For each data source, click "Save & Test". Ensure the status is "Data source is working". If not, check the URLs (e.g.,
http://loki:3100) and firewall settings on the VPS.
- Check firewall: Ensure that ports (4317, 4318, 3100, 3200, 3000) are open on the VPS if external access is required, and between Docker containers.
2. Slow queries in Grafana (to Loki or Tempo)
Possible causes:
- High label cardinality in Loki.
- Too large a time range for the query.
- Inefficient LogQL/PromQL queries.
- Insufficient resources (CPU/RAM) for Loki/Tempo.
- Slow S3-compatible storage or high network latency to it.
Diagnostic commands and steps:
- Check label cardinality in Loki: Use the query
sum by (label_name) (count_over_time({job="your-app"}[1h])) to identify high-cardinality labels. Avoid using unique IDs in labels.
- Optimize queries:
- For Loki: Start queries by filtering on low-cardinality labels, then use full-text search or regular expressions. Use
line_format to extract the necessary data.
- For Tempo: Queries by trace ID are always the fastest. If searching by attributes, ensure you are using Loki/Prometheus integration and that queries to them are efficient.
- Monitor Loki/Tempo resources: Use Grafana dashboards to monitor CPU, RAM, and disk I/O for Loki and Tempo. Pay attention to metrics like
loki_ingester_chunk_age_seconds (chunk write delay) and tempo_ingester_blocks_created_total.
- Check storage performance: If using external S3, check network latency. If MinIO is on the same VPS, ensure the disk is not overloaded.
- Increase resources: If all optimizations have been made but queries are still slow, it may be time to increase CPU/RAM for Loki/Tempo or consider horizontal scaling.
3. Disk overflow on VPS
Possible causes:
- Too large a volume of logs/traces for local MinIO.
- Incorrect retention policy configuration in Loki/Tempo.
- Accumulation of Tempo WAL files or temporary Loki files.
- Docker log rotation issues.
Diagnostic commands and steps:
- Check disk usage:
df -h
du -sh /mnt/data/*
Determine which directory is taking up the most space.
- Check retention policies: Ensure that reasonable retention periods are set in
loki-config.yaml (chunk_store_config.max_look_back_period) and tempo-config.yaml (storage.trace.retention). Verify that they are applied.
- Check MinIO: If MinIO stores data locally, ensure its buckets are not growing indefinitely.
- Check Docker container logs: Docker logs can quickly fill up the disk. Configure log rotation for the Docker Daemon.
# /etc/docker/daemon.json
{
  "log-driver": "json-file",
  "log-opts": {
    "max-size": "10m",
    "max-file": "3"
  }
}
After changing, restart Docker: sudo systemctl restart docker.
- Clean up temporary files: Sometimes Loki's temporary directories (
/tmp/loki/boltdb-shipper-cache, /tmp/loki/compactor) or Tempo's (/tmp/tempo/wal) can grow excessively. Ensure that the compactor and shipper are working correctly.
4. OpenTelemetry Collector consumes too many resources
Possible causes:
- Too large a volume of incoming data.
- Inefficient processors (e.g., too many complex transformations).
- Lack of batching.
Diagnostic commands and steps:
- Monitor Collector: Use the Collector's own metrics (available via the Prometheus exporter on
:8889) to track its CPU, RAM, and the number of received/sent spans/logs/metrics.
- Optimize configuration:
- Ensure that the
batch processor is enabled and configured.
- Use
memory_limiter to restrict RAM consumption.
- Review processors: if there are complex operations such as
transform or filter, ensure they are efficient. Perhaps some filtering should be done at the application level.
- Consider trace sampling on the Collector.
- Reduce incoming data volume: If applications generate too much noise, configure them to send only relevant telemetry.
When to contact support:
- VPS provider: If there are suspicions of hardware problems with the VPS (disk, network, CPU), or if you cannot access the server via SSH.
- OpenTelemetry, Loki, Tempo communities: If you encounter errors that seem to be bugs in the software itself, or if you cannot find a solution to the problem in the documentation. Use GitHub Issues, Discord channels, or forums.
- Your own team: If the problem is related to application instrumentation or business logic.
FAQ: Frequently Asked Questions
What is Observability and how does it differ from monitoring in 2026?
In 2026, the difference between Observability and monitoring has become even more critical. Monitoring, in essence, answers the question "What happened?", by tracking pre-known metrics and states (e.g., "CPU above 80%"). Observability, on the other hand, allows answering the question "Why did it happen?", by providing a deep understanding of the system's internal state through metrics, logs, and traces, enabling the investigation of previously unknown problems and system behavior.
Why OpenTelemetry, Loki, and Tempo, and not Elastic Stack or Jaeger?
OpenTelemetry, Loki, and Tempo are chosen for the VPS environment in 2026 due to their exceptional resource efficiency and flexibility. Elastic Stack (Elasticsearch, Kibana, Logstash) requires significantly more RAM and CPU, making it expensive for a VPS. Jaeger, while an excellent tracing tool, often requires a powerful DBMS (Cassandra or Elasticsearch) for storage, which also increases costs. Loki and Tempo are designed to work with object storage, minimizing RAM/CPU requirements and making them ideal for budget-friendly VPS solutions.
Can OpenTelemetry be used for only a part of telemetry (e.g., only for traces)?
Yes, OpenTelemetry is modular. You can use its SDK only for traces, only for metrics, or only for logs, or for any combination thereof. The OpenTelemetry Collector can also be configured to process only specific types of telemetry and route them to the appropriate backends. This allows for gradual, step-by-step implementation of Observability.
How safe is it to store logs and traces in MinIO on the same VPS?
Storing data in MinIO on the same VPS is safe, provided that the VPS is securely protected (firewall, SSH keys, regular updates). However, for critically important data and high availability, it is recommended to use cloud S3-compatible storage (AWS S3, Google Cloud Storage, Azure Blob Storage) or a dedicated MinIO cluster. For most startups and medium-sized projects on a VPS, local MinIO is an acceptable compromise between security, performance, and cost.
How long is it recommended to store logs and traces?
The retention period depends on business requirements, regulatory norms, and cost. For operational diagnostics, 7-30 days are usually sufficient. For auditing and long-term trend analysis, 90 days or more may be required. Loki and Tempo allow flexible configuration of retention policies. In 2026, with the growth of data volumes, multi-tiered storage strategies (hot, cold, archival) are increasingly being applied.
Is it necessary to sample traces if Tempo is designed for "store everything"?
Tempo is indeed designed for efficient storage of 100% of traces thanks to its architecture. However, "store everything" refers to the backend. If your application generates a very large volume of traces (e.g., tens of thousands of spans per second), then the load on the OpenTelemetry Collector and network traffic can become a bottleneck. In such cases, sampling on the OpenTelemetry Collector (e.g., Head-based sampling) will help reduce the load and control costs, while preserving valuable traces (e.g., those with errors).
Can OpenTelemetry Collector act as a Prometheus server?
No, the OpenTelemetry Collector is not a full-fledged Prometheus server. It can receive metrics in OTLP format, transform them, and export them to a Prometheus-compatible format, as well as scrape metrics from other exporters (like Prometheus). In our stack, the Collector acts as an exporter for metrics, and Grafana directly reads these metrics from the Collector. For full long-term metric storage and complex PromQL queries, a separate Prometheus server or its clustered variants (Thanos, Cortex) are typically used.
How to control traffic costs when using Observability on a VPS?
Traffic control is a key factor on a VPS. Use the OpenTelemetry Collector for maximum filtering, aggregation, and sampling of telemetry before sending it. Host MinIO (or another S3-compatible service) on the same VPS as Loki/Tempo to avoid paid outbound traffic between them. Minimize the number of outbound requests from Grafana to Loki/Tempo if they are hosted in a different data center or cloud.
What to do if the VPS can no longer handle the load?
If your VPS starts experiencing resource shortages, consider the following steps: 1) Optimize Collector, Loki, Tempo configurations (more aggressive sampling/filtering, query optimization). 2) Increase VPS resources (CPU, RAM). 3) Split components across multiple VPS instances (e.g., one for Collector/Prometheus/Grafana, another for Loki/Tempo). 4) Consider migrating to a managed Kubernetes cluster, where Loki and Tempo can be deployed in a highly available and scalable configuration.
Can existing logs be integrated with OpenTelemetry?
Yes, the OpenTelemetry Collector has various receivers that can collect logs from different sources, including files (filelog receiver), system journal (journald receiver), and Docker containers. You can also use Promtail to collect logs and send them to Loki, and then link them with OpenTelemetry traces via common attributes (trace_id).
What are the advantages of using OpenTelemetry semantic conventions?
OpenTelemetry semantic conventions provide standardized names and values for attributes (tags) of traces, metrics, and logs (e.g., http.method, db.statement, service.name). This significantly improves the readability, portability, and analyzability of telemetry, facilitating the creation of dashboards, alerts, and queries, as well as integration with various Observability tools.
Conclusion
In 2026, as distributed systems have become the norm and infrastructure complexity continues to grow, full Observability is not just a desirable feature, but a critically important component for the stability, performance, and success of any IT project. We have shown that even with the limited resources of a Virtual Private Server (VPS), it is possible to build a powerful, flexible, and cost-effective Observability system.
The combination of OpenTelemetry, Loki, and Tempo, integrated with Grafana, offers a unique balance between functionality and cost. OpenTelemetry acts as a universal standard for collecting all types of telemetry, ensuring a vendor-agnostic approach and flexibility. Loki provides a cost-effective and scalable solution for log storage, utilizing object storage and metadata indexing. Tempo revolutionizes the approach to distributed tracing, offering a "store everything" model with minimal resource requirements, also leveraging object storage.
Key success factors when implementing this stack on a VPS include: careful resource planning, effective use of the OpenTelemetry Collector for data filtering, aggregation, and sampling, proper labeling in Loki to avoid cardinality issues, and continuous monitoring of the Observability system itself. It is also important to remember deployment automation using Infrastructure as Code tools, which significantly reduces time and minimizes the likelihood of errors.
Final Recommendations:
- Start with OpenTelemetry: Instrument your applications using the OpenTelemetry SDK. This is an investment in the future that will pay off many times over.
- Use the Collector effectively: The OpenTelemetry Collector is your best friend on a VPS. Configure it to optimize traffic and backend load.
- Choose storage wisely: For a VPS, MinIO on the same server or an inexpensive cloud S3-compatible storage is an optimal choice for Loki and Tempo.
- Monitor and optimize: Regularly check the resource consumption of your Observability components and optimize configurations to avoid hidden costs.
- Automate: Manual management will quickly become a bottleneck. Automate deployment and configuration.
- Train your team: The better your team understands and uses Observability tools, the faster problems will be resolved and the higher the stability of your systems will be.
Next steps for the reader:
- Conduct a pilot deployment: Start with a small VPS and a few test services to gain practical experience in configuring OpenTelemetry, Loki, and Tempo.
- Study the documentation: Delve into the documentation for each component, especially the "Configuration" and "Troubleshooting" sections.
- Join the community: Active participation in the OpenTelemetry, Grafana Labs (Loki, Tempo) communities will keep you informed of the latest updates and allow you to receive help from experienced engineers.
- Develop an instrumentation strategy: Determine which metrics, logs, and traces are most important for your applications, and how to collect them efficiently.
Implementing full Observability is not a one-time task, but a continuous process of improvement. But with the right stack of tools and a methodical approach, you will be able to ensure the reliable operation of your distributed systems on a VPS, staying ahead of the competition in the dynamic world of 2026.
Was this guide helpful?
Full observability for distributed systems: OpenTelemetry, Loki, and Tempo on VPS 2026