info
Need a server for this guide? We offer dedicated servers and VPS in 50+ countries with instant setup.
Need a server for this guide?
Deploy a VPS or dedicated server in minutes.
Advanced Docker Application Deployment Strategies on VPS: Blue/Green and Canary Updates
TL;DR
- Seamless Deployment on VPS: Master Blue/Green and Canary strategies to minimize downtime and risks when updating Docker applications on virtual private servers.
- Blue/Green for Simplicity and Security: Ideal for applications where a complete traffic switch is acceptable; ensures fast rollback but requires double the resources during deployment.
- Canary for Gradual Rollout: Allows testing a new version on a small subset of users, minimizing the impact of potential errors and gathering feedback before a full rollout.
- Automation is Key to Success: Utilize CI/CD pipelines with Ansible, Jenkins, GitLab CI, or GitHub Actions to automate all stages of deployment and monitoring.
- Monitoring and Logging are Critical: Implement Prometheus, Grafana, ELK stack, or Loki/Promtail to track metrics, errors, and performance of both application versions in real-time.
- Resource and Cost Optimization: Through a smart choice of VPS, efficient Docker image usage, and well-thought-out strategies, costs can be significantly reduced, despite the temporary doubling of resources.
- Specific Examples and Tools for 2026: The article contains recommendations for tools, configurations, and practical use cases relevant for 2026 for successful implementation.
1. Introduction
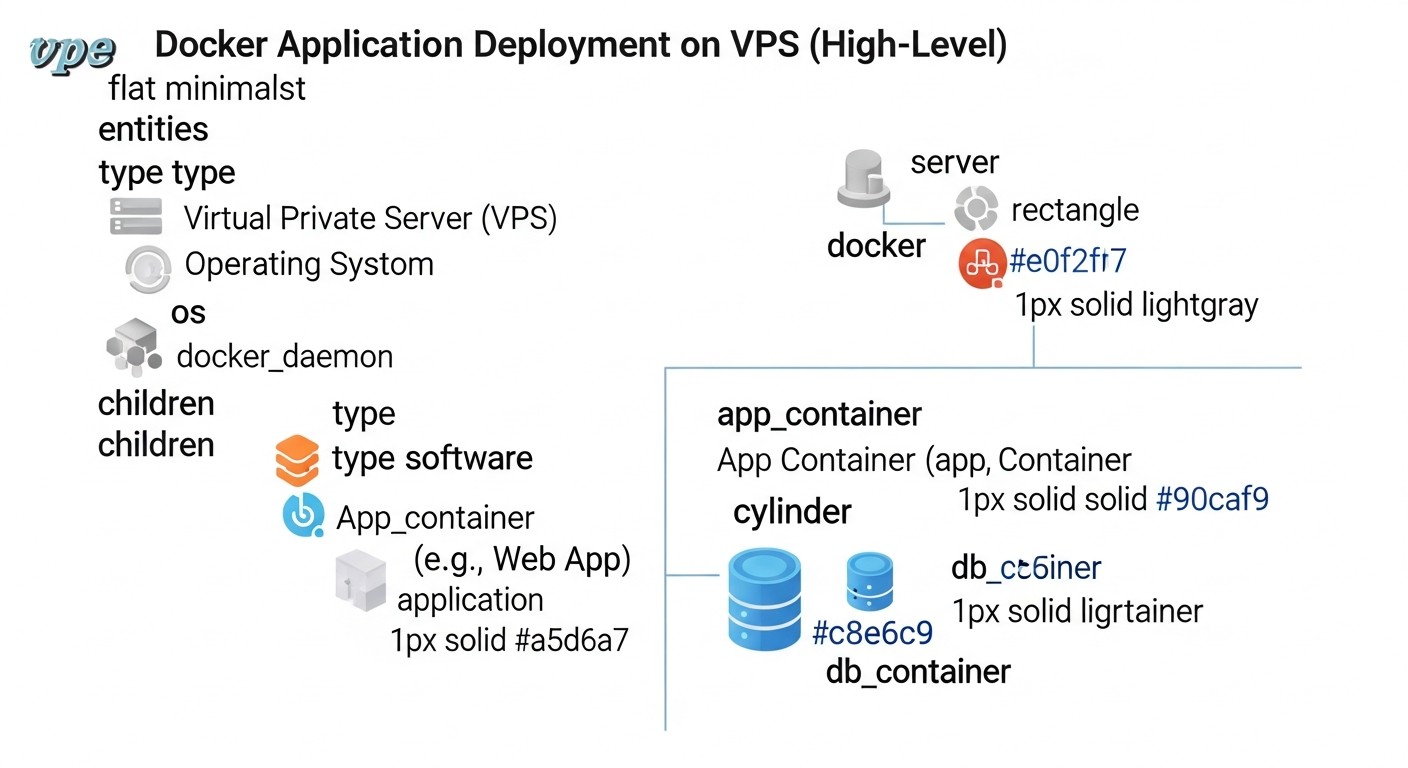 Diagram: 1. Introduction
In the rapidly evolving world of DevOps and cloud technologies, where every minute of downtime costs businesses thousands, if not millions, of dollars, ensuring uninterrupted application operation is not just a desire but a critical necessity. This is especially true for SaaS projects, where service availability directly impacts customer satisfaction, reputation, and ultimately, profit. In 2026, with microservice architecture and containerization using Docker having become the de facto standard, and VPS hostings offering unprecedented flexibility and performance at an affordable price, the issue of efficient and secure deployment comes to the forefront.
Traditional deployment methods, such as "rip-and-replace" (stopping the old version, deploying the new one), have long proven ineffective. They lead to inevitable downtime, a high risk of errors, and difficulties with rollback in case of problems. This is why the industry has embraced the need for advanced strategies, such as Blue/Green and Canary updates. These approaches allow minimizing or completely eliminating application downtime, significantly reducing risks when introducing new features, and ensuring a fast and safe rollback to the previous version.
This article is intended for a wide range of technical specialists: from experienced DevOps engineers and system administrators looking to optimize their pipelines, to backend developers (Python, Node.js, Go, PHP) wishing to better understand the infrastructure aspects of deployment. Founders of SaaS projects and technical directors of startups will find practical recommendations here for reducing operational risks and increasing the reliability of their services. We will delve into the details of Blue/Green and Canary strategies, examine their advantages and disadvantages, provide concrete examples of implementation on VPS using Docker, and discuss current tools and best practices relevant for 2026.
We will not sell you "magic pills" or "silver bullets." Instead, you will receive an expert, practical guide based on real experience and proven solutions. We will analyze how these strategies help solve problems such as:
- Minimizing Downtime: Ensuring continuous service operation during updates.
- Reducing Deployment Risks: The ability to quickly roll back or gradually introduce a new version.
- Improving Release Quality: Testing a new version in a real production environment on a limited audience.
- Increasing Team Trust: Demonstrating service stability and reliability even with frequent updates.
- Optimizing Resource Utilization: Efficient management of VPS infrastructure to support multiple application versions.
Prepare to dive into the world of advanced deployment strategies that will change your perception of how Docker applications should be updated on VPS. Let's begin.
2. Key Criteria for Choosing a Deployment Strategy
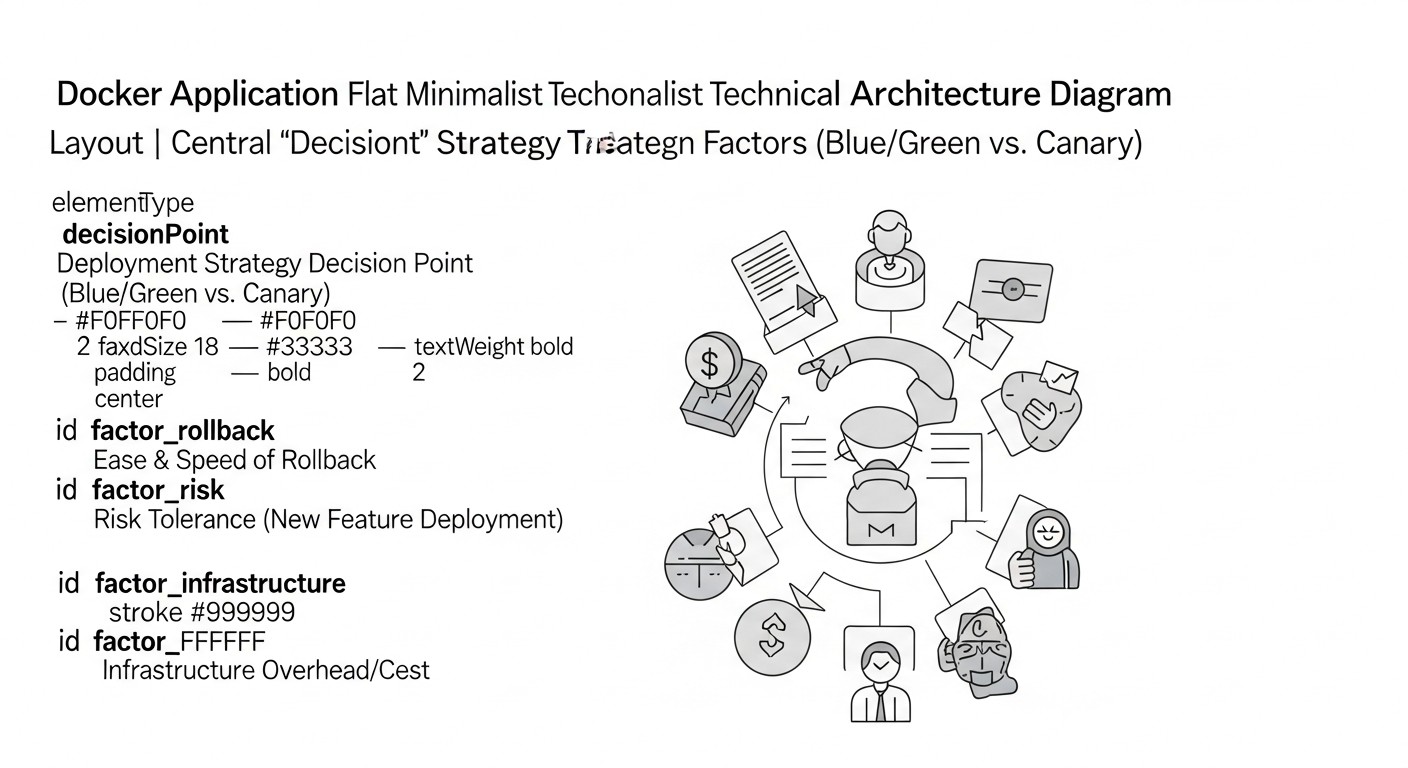 Diagram: 2. Key Criteria for Choosing a Deployment Strategy
Choosing the right deployment strategy is not just a technical decision, but a strategic choice that directly impacts the stability, reliability, and economic efficiency of your application. In 2026, as demands for release speed and quality only grow, it's important to consider many factors. Let's break down the key criteria that will help you determine which strategy—Blue/Green or Canary—best suits your needs.
2.1. Downtime Tolerance
Why it's important: This is perhaps the most obvious and critical factor. For some services (e.g., banking systems, medical platforms, e-commerce during peak hours), any downtime is unacceptable. For others (internal tools, blogs with non-critical traffic), a few minutes of downtime may be permissible. Downtime directly affects user experience, financial losses, and brand reputation. Blue/Green and Canary strategies are designed to minimize or completely eliminate downtime.
How to evaluate: Define your application's SLA (Service Level Agreement). What is the maximum permissible downtime per year, month, or week? What financial and reputational losses will downtime entail? If downtime must be zero or close to zero, then Blue/Green or Canary is your only choice.
2.2. Rollback Speed
Why it's important: Errors happen. And when they occur in production, the ability to quickly revert to a stable version becomes vital. The faster you can roll back, the less impact there will be on users and the business. Slow rollbacks can lead to prolonged downtime and exacerbate problems.
How to evaluate: Measure the time required to deploy the previous version of the application. Ideally, a rollback should take seconds or minutes. Blue/Green allows for an almost instantaneous rollback by simply switching traffic back to the "blue" (old) environment. Canary requires a more complex rollback, possibly a phased decommissioning of the "canary" and returning traffic to the stable version.
2.3. Implementation Complexity & Management Overhead
Why it's important: Each deployment strategy has its own learning curve and requires specific skills and tools. A complex strategy may require more time for setup, more resources for support, and increase the likelihood of errors with manual management. In the context of limited VPS resources and a small team, this can be critical.
How to evaluate: Assess your team's skill level. Do you have experience with load balancers, dynamic DNS, CI/CD pipelines? Are you willing to invest time in learning and configuration? Blue/Green is relatively simple in concept but requires careful traffic management. Canary is more complex, as it involves fine-tuning traffic routing (users, percentage) and more sophisticated monitoring.
2.4. Resource Consumption
Why it's important: Deploying on a VPS is often associated with limited resources. The Blue/Green strategy, by its nature, requires at least double the resources for a short period (old and new versions run in parallel). Canary can be more economical if you gradually replace old instances with new ones, but for full A/B testing or parallel operation of two versions, additional resources will still be needed.
How to evaluate: Analyze the current load on your VPS. Do you have spare capacity for CPU, RAM, disk space? Are you willing to temporarily scale your VPS or use additional instances? The cost of VPS resources in 2026, although it has decreased, is still a significant factor. Assess whether you can afford to double resources for 10-30 minutes during deployment.
2.5. Testing & Validation Capabilities
Why it's important: The earlier you detect an error, the cheaper it will be. Deployment strategies should provide opportunities to test the new version in conditions as close to production as possible before it becomes available to all users. This includes functional testing, load testing, performance monitoring, and metric collection.
How to evaluate: Blue/Green allows for full testing of the new "green" environment before switching traffic. Canary goes further, allowing testing of the new version on real users, collecting metrics and feedback before fully rolling it out. This is especially valuable for assessing user experience and performance in real-world conditions.
2.6. Database & Data Migration Compatibility
Why it's important: Application updates often involve changes to the database schema. This is one of the most complex parts of deployment, as it can disrupt both the old and new versions of the application. It is important to ensure that your deployment strategy supports backward and forward compatibility with database changes.
How to evaluate: Plan database migrations so that they are non-blocking and backward compatible. For example, when adding a new column, first deploy the new version of the application that can work with the new column (but does not require it). Then perform the DB migration, and after that, switch traffic. When deleting a column, first ensure that all old versions using that column are decommissioned. This requires careful planning and possibly the use of patterns such as "Two-Phase Schema Migration".
2.7. Fault Tolerance Requirements
Why it's important: Even with the most well-thought-out strategies, failures can occur. Your system must be designed to withstand failures of individual components or entire application versions. This includes automatic problem detection, switching to backup resources, and isolating faulty parts.
How to evaluate: Assess how critical it is for your business that the system continues to operate even with a partial failure. Blue/Green provides high fault tolerance during rollback, as the old version remains available. Canary, thanks to its gradual rollout, limits the impact of a failure to only a portion of users, which increases the overall fault tolerance of the system during the deployment process.
A thorough analysis of these criteria will allow you to choose the most suitable deployment strategy, one that not only minimizes risks and downtime but is also economically justifiable and manageable for your team and VPS infrastructure.
3. Comparative Table: Blue/Green vs. Canary Deployments
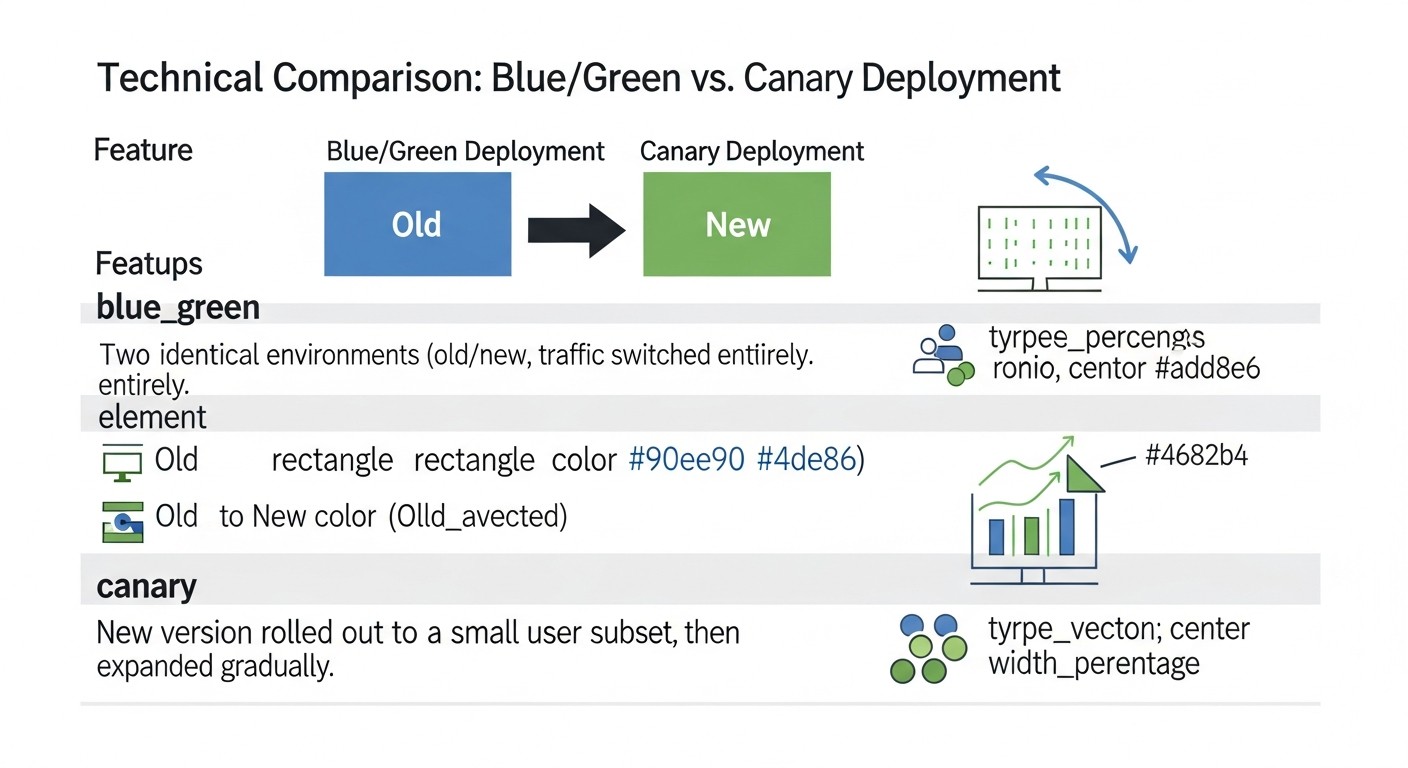 Diagram: 3. Comparative Table: Blue/Green vs. Canary Deployments
The choice between Blue/Green and Canary deployment strategies often comes down to a compromise between simplicity, rollback speed, and the ability to test on real users. In this table, we will present a detailed comparison of both strategies, considering current realities and expectations for 2026, including approximate costs and technical features.
| Criterion |
Blue/Green Deployment |
Canary Deployment |
| Core Idea |
Two identical environments (Blue - old, Green - new). Traffic is switched entirely to Green after successful testing. |
Gradual rollout of a new version (Canary) to a small subset of users, then increasing the percentage. |
| Downtime during deployment |
Virtually zero (traffic switching time). |
Zero, as the old version continues to serve most users. |
| Rollback Speed |
Instant (switching traffic back to Blue). |
Takes more time, as the Canary needs to be taken out of service and traffic redirected. |
| Resource Consumption (VPS) |
Temporarily doubles consumption (Blue + Green environments). For example, 2x VPS or 2x set of containers. |
Can be more efficient if Canary occupies a small portion of resources. At peak, it can be 1.1x - 1.5x of normal. |
| Implementation Complexity |
Medium. Requires managing two environments and a load balancer. |
High. Requires complex traffic routing, advanced monitoring, and automation. |
| Testing Capabilities |
Full testing of the new version before launch. |
Testing on real users, A/B testing, collecting performance metrics and errors in production. |
| Error Detection |
Errors are detected before traffic switching (in Green). |
Errors are detected on a small subset of users, minimizing overall impact. |
| Database Management |
Requires careful planning of migrations with backward compatibility. |
Even stricter requirement for backward compatibility, as both versions can simultaneously work with the DB. |
| Ideally suited for |
Critical applications with high SLA, where fast rollback and full testing before release are required. |
Applications where it is important to minimize risk, test new features on a live audience, and gradually introduce changes. |
| Approximate additional VPS costs (2026) |
Short-term +100%: If your service runs on 2 VPS at $20/month, then for the duration of deployment, 4 VPS will be needed, i.e., $80/month instead of $40/month (for a few minutes/hours). In the long term, this might be +$5-10/month for a more powerful VPS or an additional instance for a few hours. |
Long-term +10-50%: For example, if your service runs on 2 VPS at $20/month, Canary might require 2 main + 1 additional VPS (for Canary), or more powerful VPS to host more containers. This could be +$20/month constantly if Canary instances run for a long time. |
| Key Tools (2026) |
Docker Compose, Nginx/Caddy, HAProxy, Ansible, GitLab CI/GitHub Actions, Prometheus, Grafana. |
Docker Compose, Nginx/Caddy, HAProxy, Traefik, Istio (for more complex scenarios), Kubernetes, Ansible, GitLab CI/GitHub Actions, Prometheus, Grafana, OpenTelemetry. |
This table clearly demonstrates that there is no "best" strategy; there is one that is better suited for a specific scenario, budget, and team maturity level. Blue/Green provides the simplicity and security of a full switch, while Canary offers unparalleled opportunities for gradual rollout and real-time testing, but at the cost of greater complexity and potential ongoing resource costs.
4. Detailed Overview of Blue/Green Deployment
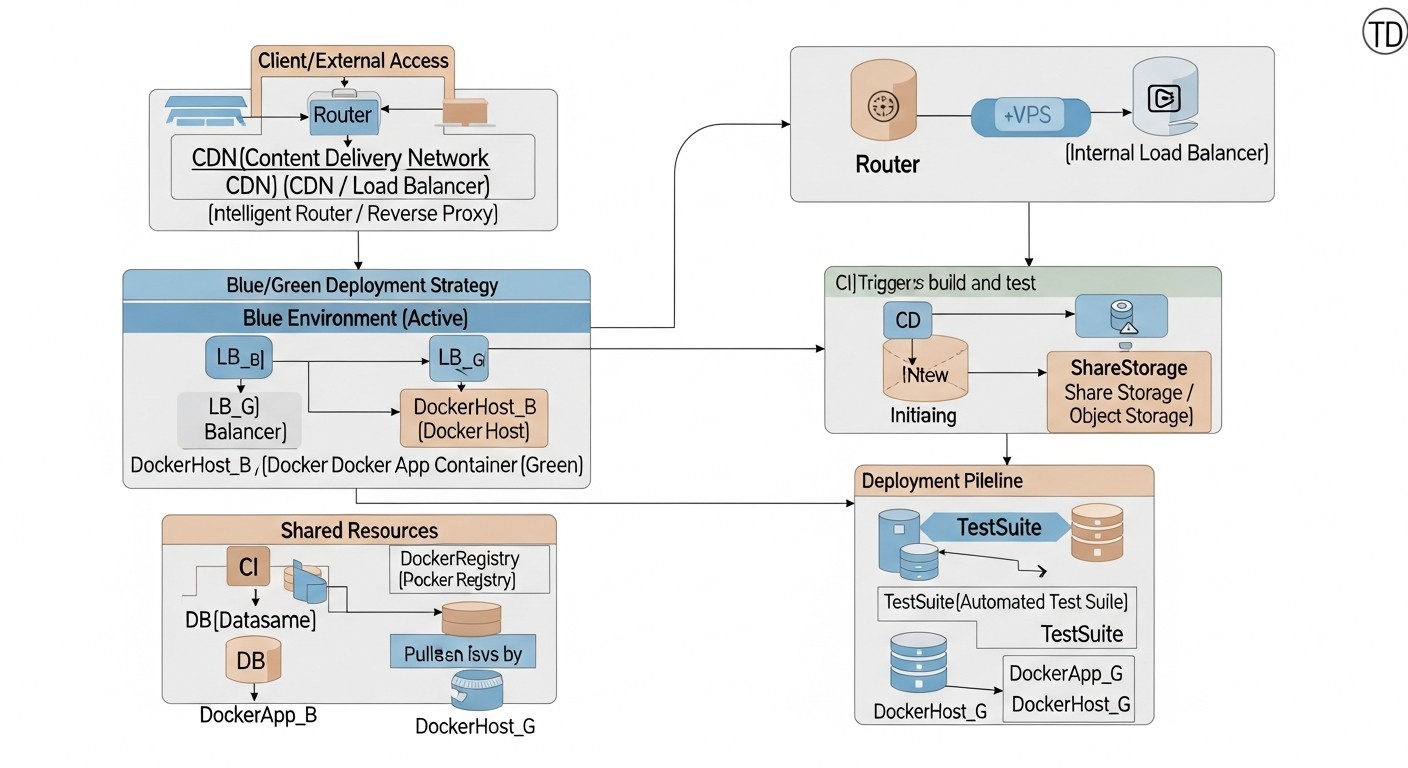 Diagram: 4. Detailed Overview of Blue/Green Deployment
The Blue/Green deployment strategy is one of the most popular and effective methods for ensuring seamless application updates with minimal downtime. Its key idea is to maintain two identical production environments, which we metaphorically call "Blue" and "Green." At any given time, only one of these environments is active and serves all user traffic. Let's delve into the details of this strategy.
4.1. Principle of Blue/Green Operation
Imagine you have two completely identical infrastructures or sets of resources on your VPS. One of them, say "Blue," contains the current, stable version of your Docker application and serves all incoming traffic. When it's time to update the application, you deploy the new version to the "Green" environment, which until this point was inactive or contained an older version, but without traffic.
- Preparing the "Green" environment: You deploy the new version of your application's Docker image to the "Green" infrastructure. This could be a separate Docker container, a group of containers, or even a separate VPS configured identically to the "Blue" one.
- Testing the "Green" environment: After deploying the new version to the "Green" environment, you conduct all necessary tests: functional, integration, load tests. This gives you confidence that the new version works correctly in production conditions, but without affecting real users yet.
- Traffic switching: If the tests are successful, you switch all incoming user traffic from the "Blue" environment to the "Green" one. This is usually done by changing the configuration of a load balancer (e.g., Nginx, HAProxy, Caddy) or DNS records. This switch happens almost instantly.
- Monitoring the "Green" environment: After switching traffic, you carefully monitor the operation of the new "Green" environment, collecting performance metrics, errors, and logs.
- Rollback: If critical problems are discovered in the "Green" environment, you can instantly roll back by simply switching traffic back to the stable "Blue" environment. This happens very quickly and safely, as the "Blue" environment remained untouched.
- Cleanup or reuse: If the "Green" environment is stable, the "Blue" environment can either be destroyed (to save resources) or updated to the new version and become the next "Green" environment for a future deployment.
4.2. Advantages of Blue/Green Deployment
- Zero downtime: Traffic switching happens very quickly, usually within seconds, minimizing or completely eliminating downtime for users.
- Fast and safe rollback: In case of problems, reverting to the previous stable version happens instantly, simply by switching traffic back to the "Blue" environment. This provides a high degree of confidence in the deployment process.
- Ease of testing: The new version can be fully tested in the production environment before becoming available to users, which reduces the risk of introducing errors into production.
- Environment isolation: "Blue" and "Green" environments are completely isolated, which prevents conflicts and simplifies management.
- Release confidence: The ability to quickly roll back reduces stress and increases team confidence in each new release.
4.3. Disadvantages of Blue/Green Deployment
- Resource doubling: During deployment, computational resources (CPU, RAM, disk space) need to be doubled, as both environments (Blue and Green) run in parallel. On a VPS, this might mean temporary scaling or using a more powerful server.
- State management: If the application has state (e.g., user sessions, caches), their correct handling must be ensured during switching. This may require using shared state stores (Redis, Memcached) or careful session design.
- Database migrations: Changes in the database schema require special attention. Migrations must be backward compatible so that both versions of the application (old and new) can work with the same database during the transition period.
- Complexity for very large applications: For monolithic applications with many dependencies or very complex infrastructure, creating two completely identical environments can be costly and time-consuming.
4.4. Who Blue/Green is suitable for
Blue/Green deployment is ideal for:
- SaaS projects with high SLA: Where zero downtime and fast rollback are critically important.
- Applications with frequent but predictable releases: When you are confident in code quality after internal testing but want additional insurance in production.
- Teams that value simplicity and predictability: The concept is relatively easy to understand and implement compared to Canary, especially on a VPS using Docker Compose and Nginx/HAProxy.
- Projects capable of temporarily allocating additional resources: If your VPS can handle a temporary doubling of load or you are willing to temporarily scale up.
Overall, Blue/Green is an excellent starting point for many teams striving for seamless deployment. It provides a high level of security and reliability while remaining relatively manageable to implement on a VPS.
5. Detailed Overview of Canary Deployment
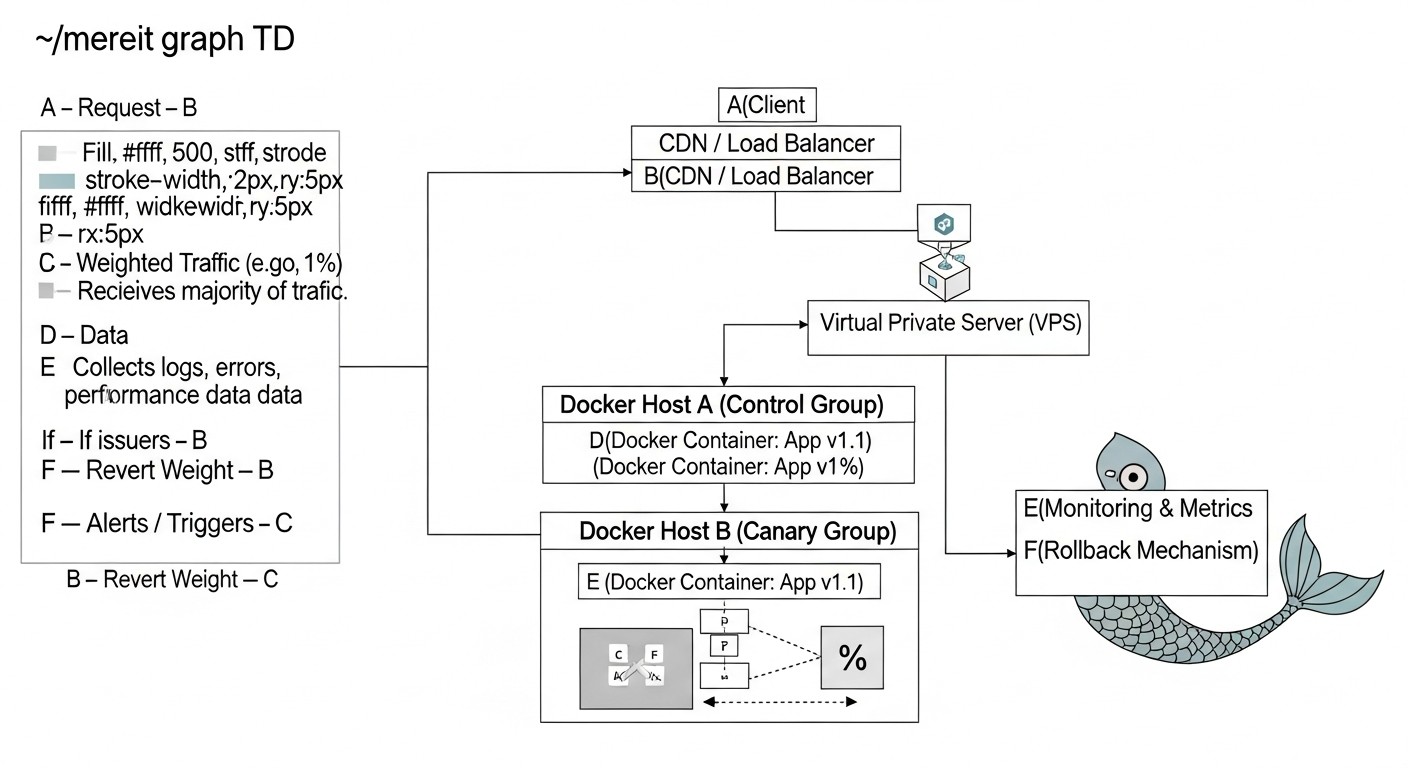 Diagram: 5. Detailed Overview of Canary Deployment
Canary deployment, named after canaries used in mines to detect dangerous gases, is an advanced deployment strategy that allows a new version of an application to be gradually rolled out to a limited group of users. This minimizes the potential impact of errors on the entire user base and provides an opportunity to collect real-time feedback and metrics before the new version becomes generally available. In 2026, with the growing popularity of A/B testing and personalization, Canary is becoming an indispensable tool.
5.1. How Canary Works
Unlike Blue/Green, where traffic is switched entirely, Canary deployment involves phased traffic redirection. This allows you to "test the waters" on a small, isolated group of users.
- Deploying the "canary": You deploy a new version of your Docker application (the so-called "canary") alongside the current stable version on your VPS. Initially, no traffic or a very small percentage of traffic is directed to the "canary".
- Redirecting a small percentage of traffic: The load balancer or API Gateway is configured to redirect a very small percentage (e.g., 1-5%) of incoming traffic to the "canary". The remaining traffic continues to be served by the stable version.
- Monitoring and metric collection: This is the most critical stage. You carefully monitor performance, errors, user behavior, and business metrics for the "canary". It is important to have a well-configured monitoring system that allows comparing the "canary's" metrics with the stable version.
- Gradual traffic increase: If the "canary" shows stable operation and good metrics, you gradually increase the percentage of traffic directed to it (e.g., to 10%, then 25%, 50%, and so on). Each stage is accompanied by careful monitoring.
- Full rollout: When the "canary" successfully serves a significant portion of traffic without issues, and you are fully confident in its stability, you redirect all 100% of the traffic to the new version.
- Retiring the old version: The old version of the application can be decommissioned and its resources freed up.
- Rollback: If problems are detected at any stage, you immediately redirect all traffic back to the stable version. Since the impact was limited to a small group of users, the damage is minimized.
5.2. Advantages of Canary Deployment
- Minimal risk: The impact of potential errors is limited to a small portion of users, making this strategy ideal for critical systems.
- Real-time testing: The new version is tested on real users in a real production environment, which helps identify problems that might have been missed during synthetic testing.
- A/B testing: Canary deployment naturally allows for A/B testing of new features, comparing their effectiveness with older ones based on user behavior and business metrics.
- Gradual adoption: The ability to gradually get used to new features and collect feedback, which is especially useful for radical changes in the user interface or business logic.
- Resource savings: In the initial stages, the "canary" may require fewer additional resources compared to full duplication in Blue/Green.
5.3. Disadvantages of Canary Deployment
- High complexity: Requires complex load balancer configuration for traffic routing based on various criteria (percentage, headers, cookies), as well as an advanced monitoring and logging system.
- Duration: The Canary deployment process can take significantly longer than Blue/Green, as each stage requires monitoring and decision-making.
- State and database management: Even more critical than in Blue/Green. Both versions of the application (stable and "canary") must be able to work with the same database schema and state. Migrations must be strictly backward compatible.
- Debugging information issues: If an error only manifests on the "canary", it can be difficult to gather sufficient information for debugging if the traffic is too small.
- Potential degradation of user experience: Although for a small group, some users may still encounter errors or regressions.
5.4. Who Canary is Suitable For
Canary deployment is ideal for:
- Large SaaS projects with millions of users: Where even a small percentage of errors can affect a significant number of people.
- Applications where continuous feedback and metric collection are important: For A/B testing new features, evaluating performance, and user reactions.
- Teams with a high level of automation and a mature DevOps culture: Requires developed CI/CD pipelines, deep monitoring, and automatic rollbacks.
- Projects willing to invest in complex infrastructure: For configuring advanced load balancers (e.g., Traefik, Nginx with Lua scripts), monitoring, and logging systems.
- When changes can be risky: For example, when implementing a new payment system, changing critical business logic, or significant UI updates.
Canary deployment is a powerful tool for minimizing risks and improving release quality, but it requires significant investment in automation, monitoring, and orchestration. On a VPS, it can be implemented using Docker Compose, Nginx/HAProxy, and scripts for traffic management, but for more complex scenarios, Kubernetes or its lightweight alternatives may be required.
6. Practical Tips and Recommendations for Implementation
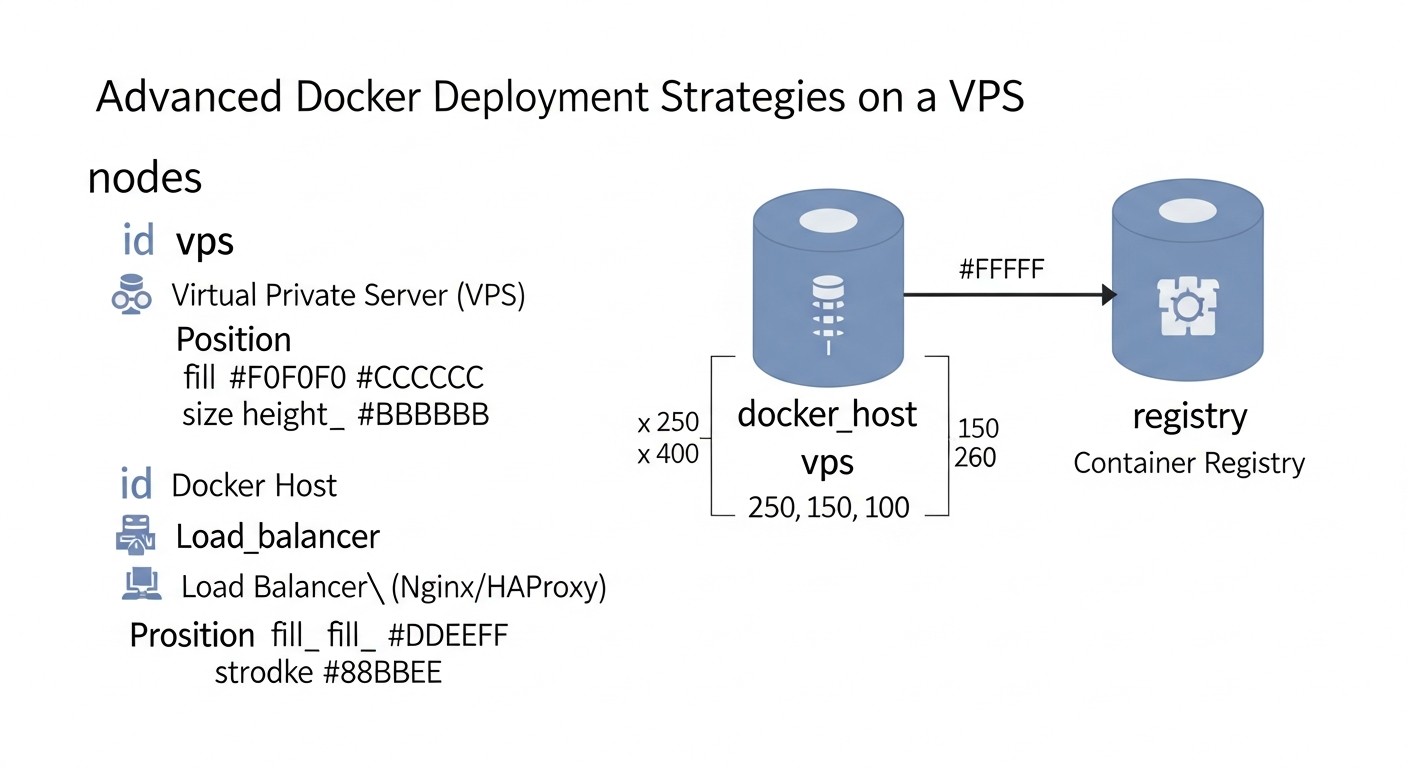 Diagram: 6. Practical Tips and Recommendations for Implementation
Implementing Blue/Green and Canary deployments on a VPS requires not only an understanding of the concepts but also specific technical steps. In this section, we will provide step-by-step instructions, command and configuration examples, as well as recommendations based on real-world experience implementing these strategies in 2026.
6.1. General VPS Infrastructure Requirements
- Sufficient VPS Resources: Ensure your VPS has enough CPU, RAM, and disk space to run at least two versions of your application (for Blue/Green) or a stable version plus a "canary" (for Canary). Consider using a VPS with fast vertical scaling capabilities or the ability to add temporary instances.
- Docker and Docker Compose: Installed and configured on your VPS. Docker Compose will be used to orchestrate multiple containers that make up your application.
- Load Balancer (Reverse Proxy): Nginx, Caddy, or HAProxy are excellent candidates. They will be responsible for routing traffic to the correct application version.
- Monitoring and Logging System: Prometheus + Grafana for metrics, ELK stack (Elasticsearch, Logstash, Kibana) or Loki + Promtail for logs. This is critical for tracking the health and performance of both versions.
- CI/CD Pipeline: Automate the entire deployment process using Jenkins, GitLab CI, GitHub Actions, or Ansible. Manual deployment increases risks and labor costs.
6.2. Implementing Blue/Green Deployment on a Single VPS with Docker Compose and Nginx
Suppose you have an application consisting of a web server and a database. For Blue/Green, we will need two sets of containers for the application, but a shared database.
6.2.1. Project Structure
Let's create two folders for different versions of the application, for example, app-blue and app-green. Each will have its own docker-compose.yml.
# Directory Structure
.
├── nginx.conf
├── app-blue/
│   └── docker-compose.yml
│   └── Dockerfile
│   └── app.py (version 1.0)
├── app-green/
│   └── docker-compose.yml
│   └── Dockerfile
│   └── app.py (version 2.0)
└── data/
    └── db/ (for PostgreSQL/MySQL)
6.2.2. Example app-blue/docker-compose.yml (for version 1.0)
version: '3.8'
services:
  web:
    build:
      context: .
      dockerfile: Dockerfile
    image: myapp:1.0
    container_name: myapp_blue_web
    ports:
      - "8080:80" # Listen on port 8080
    environment:
      - APP_VERSION=1.0
      - DATABASE_URL=postgresql://user:password@db:5432/mydatabase
    volumes:
      - ./app.py:/app/app.py
    networks:
      - app_network
  db: # Shared database
    image: postgres:14
    container_name: myapp_db
    environment:
      POSTGRES_DB: mydatabase
      POSTGRES_USER: user
      POSTGRES_PASSWORD: password
    volumes:
      - ../data/db:/var/lib/postgresql/data
    networks:
      - app_network
    restart: unless-stopped # Important for shared DB
networks:
  app_network:
    driver: bridge
6.2.3. Example app-green/docker-compose.yml (for version 2.0)
Similarly, but with a different port and container name:
version: '3.8'
services:
  web:
    build:
      context: .
      dockerfile: Dockerfile
    image: myapp:2.0
    container_name: myapp_green_web
    ports:
      - "8081:80" # Listen on port 8081
    environment:
      - APP_VERSION=2.0
      - DATABASE_URL=postgresql://user:password@db:5432/mydatabase
    volumes:
      - ./app.py:/app/app.py
    networks:
      - app_network
networks:
  app_network:
    external: true # Use the same network as Blue for shared DB access
Note: In a real scenario, the DB should be a separate service accessible to both environments, not part of each environment's docker-compose.yml. Here, for simplicity, it is included in Blue, and Green connects to it via the shared network.
6.2.4. Nginx Configuration (nginx.conf)
Nginx will act as a load balancer, switching traffic between ports 8080 (Blue) and 8081 (Green).
# nginx.conf
worker_processes auto;

events {
    worker_connections 1024;
}

http {
    include mime.types;
    default_type application/octet-stream;
    sendfile on;
    keepalive_timeout 65;

    upstream app_backend {
        # Initially direct to Blue
        server 127.0.0.1:8080; # Blue
        # server 127.0.0.1:8081; # Green (commented out)
    }

    server {
        listen 80;
        server_name your_domain.com;

        location / {
            proxy_pass http://app_backend;
            proxy_set_header Host $host;
            proxy_set_header X-Real-IP $remote_addr;
            proxy_set_header X-Forwarded-For $proxy_add_x_forwarded_for;
            proxy_set_header X-Forwarded-Proto $scheme;
        }
    }
}
6.2.5. Blue/Green Deployment Process
- Start Blue (current version):
cd app-blue
docker-compose up -d --build
Ensure Nginx is configured for port 8080.
- Prepare Green (new version):
cd app-green
docker-compose up -d --build
This will launch the new version on port 8081. Conduct testing by directly accessing http://your_vps_ip:8081.
- Switch Traffic:
Once Green is tested, update nginx.conf by changing upstream app_backend:
    upstream app_backend {
        # server 127.0.0.1:8080; # Blue (commented out)
        server 127.0.0.1:8081; # Green (active)
    }
Reload Nginx: sudo systemctl reload nginx.
- Monitoring: Carefully monitor Green's logs and metrics.
- Clean up Blue (or prepare for next deployment):
If Green is stable, stop Blue:
cd app-blue
docker-compose down
- Rollback: If Green causes issues, immediately change
nginx.conf back to server 127.0.0.1:8080; and reload Nginx.
6.3. Implementing Canary Deployment on a Single VPS with Docker Compose and Nginx/Caddy
Canary is more complex as it requires dynamic traffic routing. Nginx can achieve this using Lua scripts or more complex configurations, but for simplicity, we will consider a basic approach using weights or headers.
6.3.1. Nginx for Canary (by weights)
This is the simplest Canary, where traffic is distributed by weights.
# nginx.conf for Canary (by weights)
upstream app_backend {
    server 127.0.0.1:8080 weight=90; # Blue (old version, 90% traffic)
    server 127.0.0.1:8081 weight=10; # Canary (new version, 10% traffic)
}

server {
    listen 80;
    server_name your_domain.com;

    location / {
        proxy_pass http://app_backend;
        proxy_set_header Host $host;
        proxy_set_header X-Real-IP $remote_addr;
        proxy_set_header X-Forwarded-For $proxy_add_x_forwarded_for;
        proxy_set_header X-Forwarded-Proto $scheme;
    }
}
Process:
- Launch Blue on 8080.
- Launch Canary on 8081.
- Update
nginx.conf with weights (e.g., 90% Blue, 10% Canary). Reload Nginx.
- Monitoring. If all is well, gradually change the weights (e.g., 70/30, 50/50, 20/80, 0/100) and reload Nginx at each step.
- When 100% of traffic goes to Canary, stop Blue.
6.3.2. Canary by Headers/Cookies (for internal testers)
A more advanced Canary can direct traffic to the new version only for specific users (e.g., with a specific HTTP header or cookie).
# nginx.conf for Canary (by headers)
upstream app_blue {
    server 127.0.0.1:8080;
}
upstream app_canary {
    server 127.0.0.1:8081;
}

server {
    listen 80;
    server_name your_domain.com;

    location / {
        # If "X-Canary: true" header exists, direct to Canary
        if ($http_x_canary = "true") {
            proxy_pass http://app_canary;
        }
        # Otherwise, to Blue
        proxy_pass http://app_blue;

        proxy_set_header Host $host;
        proxy_set_header X-Real-IP $remote_addr;
        proxy_set_header X-Forwarded-For $proxy_add_x_forwarded_for;
        proxy_set_header X-Forwarded-Proto $scheme;
    }
}
Process:
- Launch Blue on 8080.
- Launch Canary on 8081.
- Update
nginx.conf. Reload Nginx.
- Test Canary by sending requests with the header
X-Canary: true.
- Once confident that Canary is stable, modify
nginx.conf so that all traffic goes to app_canary, or use weights as in the previous example for gradual rollout.
6.4. Automating the CI/CD Pipeline (using GitLab CI as an example)
Automation is the heart of effective deployment. Manual management of Nginx and Docker Compose quickly becomes unmanageable.
Example .gitlab-ci.yml for Blue/Green:
stages:
  - build
  - deploy_green
  - switch_traffic
  - cleanup_blue

variables:
  DOCKER_HOST_USER: "user"
  DOCKER_HOST_IP: "your_vps_ip"
  APP_DIR: "/path/to/your/app"
  BLUE_PORT: "8080"
  GREEN_PORT: "8081"

build:
  stage: build
  script:
    - docker build -t myapp:$CI_COMMIT_SHORT_SHA .
    - docker save myapp:$CI_COMMIT_SHORT_SHA | gzip > myapp-$CI_COMMIT_SHORT_SHA.tar.gz
    - scp myapp-$CI_COMMIT_SHORT_SHA.tar.gz $DOCKER_HOST_USER@$DOCKER_HOST_IP:$APP_DIR/
  tags:
    - docker_builder # Example tag for runner

deploy_green:
  stage: deploy_green
  script:
    - ssh $DOCKER_HOST_USER@$DOCKER_HOST_IP "
        cd $APP_DIR/app-green &&
        docker load < myapp-$CI_COMMIT_SHORT_SHA.tar.gz &&
        docker-compose down || true && # Stop previous Green, if any
        sed -i 's/image: myapp:.$/image: myapp:$CI_COMMIT_SHORT_SHA/' docker-compose.yml &&
        docker-compose up -d --build &&
        # Here you can add scripts to run tests on Green
        # For example: curl -f http://$DOCKER_HOST_IP:$GREEN_PORT/health || exit 1
        "
  tags:
    - deployer
  allow_failure: false

switch_traffic:
  stage: switch_traffic
  script:
    - ssh $DOCKER_HOST_USER@$DOCKER_HOST_IP "
        sed -i 's/server 127.0.0.1:$BLUE_PORT;/ # server 127.0.0.1:$BLUE_PORT;/' $APP_DIR/nginx.conf &&
        sed -i 's/# server 127.0.0.1:$GREEN_PORT;/ server 127.0.0.1:$GREEN_PORT;/' $APP_DIR/nginx.conf &&
        sudo systemctl reload nginx
        "
  tags:
    - deployer
  when: manual # Manual confirmation after Green testing

cleanup_blue:
  stage: cleanup_blue
  script:
    - ssh $DOCKER_HOST_USER@$DOCKER_HOST_IP "
        cd $APP_DIR/app-blue &&
        docker-compose down &&
        rm -f myapp-$CI_COMMIT_SHORT_SHA.tar.gz
        "
  tags:
    - deployer
  when: manual # Manual confirmation after successful switch
Important CI/CD Notes:
- Use SSH keys for passwordless access to the VPS.
- Environment variables for sensitive data (passwords, keys).
sed -i for modifying Nginx configuration files. In more complex scenarios, Ansible templates can be used.when: manual for switching and cleanup stages to ensure manual review and confirmation. Ideally, after automated tests on Green, a pause can be made for a manual smoke test.- Add full-fledged tests (health checks, integration tests) to the pipeline.
- For Canary, the pipeline will be more complex, with stages for gradual traffic increase and monitoring after each step.
6.5. Monitoring and Logging
Monitoring is your eyes and ears in production. Without it, Blue/Green and Canary deployments lose their meaning.
- Metrics: Use Prometheus to collect metrics (CPU, RAM, VPS network traffic, as well as your application's metrics: request count, latencies, errors). Exporters for Docker, Node Exporter for VPS, and custom exporters for your application. Grafana for visualization.
- Logs: Collect logs from all containers.
- Simple Solution: Use
docker logs -f <container_name> or configure Docker's log-driver to json-file and collect them using journalctl.
- Advanced Solution: ELK stack (Elasticsearch, Logstash, Kibana) or Loki + Promtail. Promtail collects logs from Docker containers and sends them to Loki, while Grafana is used for querying Loki.
- Alerts: Configure alerts (via Alertmanager for Prometheus) for any anomalies: increase in errors in the new version, performance degradation, high resource utilization.
- Tracing (Distributed Tracing): For microservice architectures, consider OpenTelemetry or Jaeger/Zipkin for tracing requests across multiple services. This helps understand exactly where a problem occurred in a Canary deployment.
6.6. Database Management
DB migrations are the weakest link in seamless deployments. Always follow the principle of backward compatibility:
- Adding a Column: First, deploy the new version of the application that can work with the new column (but doesn't require it). Then, perform the DB migration. After that, switch traffic.
- Deleting a Column: First, ensure that all old versions using this column are out of service. Then, delete the column from the DB.
- Changing Column Type: Often requires a two-phase migration: first adding a new column with the new type, migrating data, switching the application to the new column, then deleting the old one.
Use DB migration tools such as Alembic (Python), Flyway (Java), Liquibase, Knex.js (Node.js).
Implementing these practical tips will allow you to create a reliable and automated deployment process that will significantly reduce risks and increase the stability of your Docker applications on a VPS.
7. Common Mistakes When Implementing Blue/Green and Canary
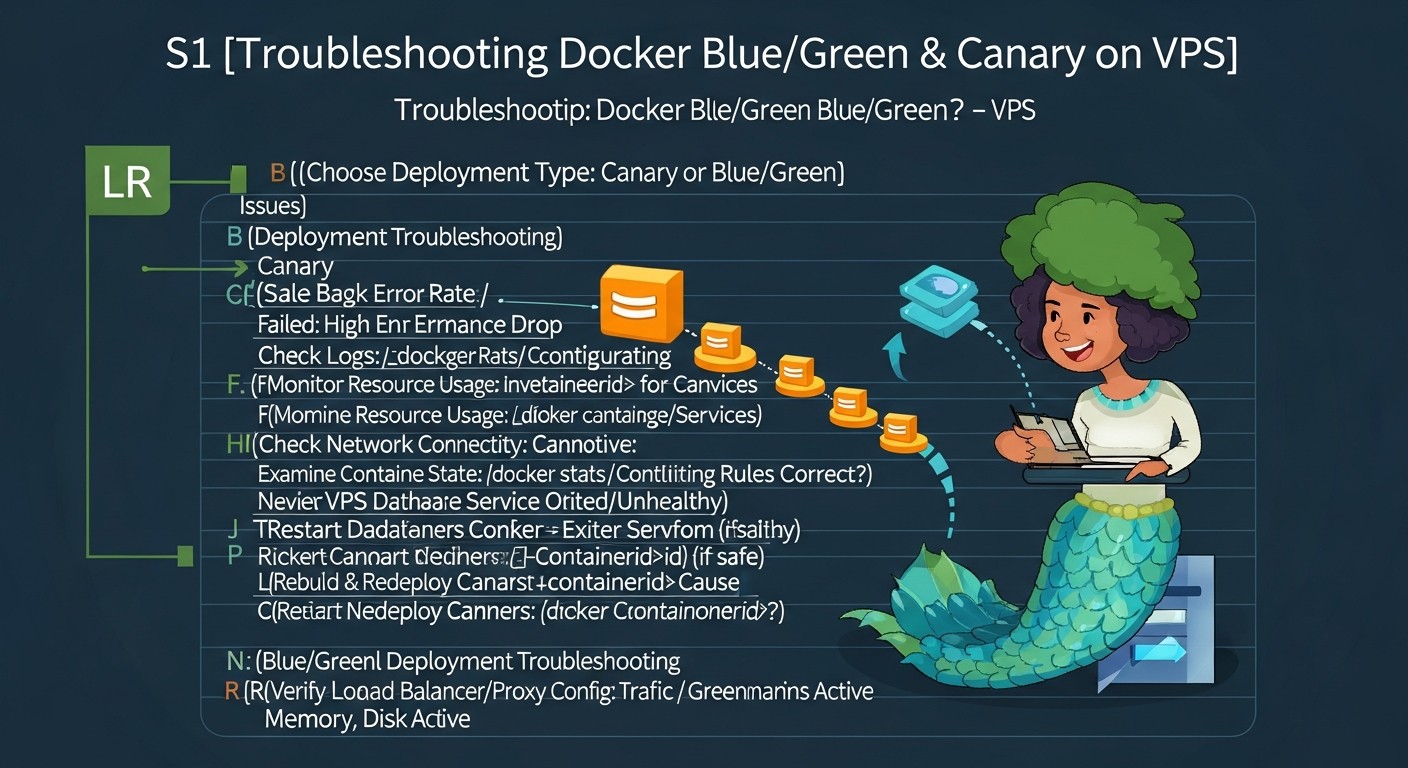 Diagram: 7. Common Mistakes When Implementing Blue/Green and Canary
Implementing advanced deployment strategies, such as Blue/Green and Canary, can significantly improve the stability and reliability of your releases. However, like any complex engineering task, it comes with a number of common mistakes that can negate all benefits and even lead to serious problems. In 2026, when automation and speed have become key, these mistakes can be particularly costly.
7.1. Insufficient Testing of the "Green" or "Canary" Environment
Description of the mistake: This is perhaps the most common and dangerous mistake. Developers or DevOps engineers rely on the new version "just working" or perform only superficial checks. Sometimes, due to haste, integration or load tests are skipped on the new environment, or tests are conducted in an isolated test environment that does not fully match production. In the case of Canary, this manifests as insufficient monitoring on a small percentage of traffic.
How to avoid: Implement a comprehensive testing strategy, including unit, integration, E2E (End-to-End), and load tests. Automate these tests in your CI/CD pipeline. For Blue/Green, ensure that the "green" environment is fully functional and stable under load before switching traffic to it. For Canary, establish clear success criteria and metrics that must be met before increasing the traffic percentage. Use tools like Selenium, Cypress, JMeter, K6.
Example of consequences: Switching to a "green" environment with a critical error that only manifests under load leads to a complete service failure for all users. In the case of Canary, even 1% of users may encounter a fatal error, which undermines trust and reputation.
7.2. Lack of or Ineffective Monitoring and Alerting
Description of the mistake: Deploying without a reliable monitoring and alerting system is like flying blind. If you don't know what's happening with your application after deployment, you won't be able to react quickly to problems. Often, teams set up basic monitoring but not custom application metrics, or they lack clear thresholds for alerts.
How to avoid: Implement end-to-end monitoring: infrastructure (CPU, RAM, VPS disk), Docker containers, the application itself (request metrics, errors, latencies, business metrics). Use Prometheus + Grafana for metrics, Loki/ELK for logs. Configure Alertmanager to send notifications to Slack, PagerDuty, or via email when error thresholds, latencies, or unavailability are exceeded. Ensure that metrics are available for both application versions so their performance can be compared.
Example of consequences: A new version of the application slowly "dies" due to a memory leak or too many database requests, but the team only finds out an hour later when users are already complaining en masse, and rolling back takes precious time.
7.3. Incorrect State Management and Database Migrations
Description of the mistake: This is the Achilles' heel of many seamless deployment strategies. If an application has state (sessions, caches) or requires database migrations, simply switching traffic can lead to data incompatibility, loss of user sessions, or data corruption. It's often forgotten that both versions of the application might simultaneously operate with the same database.
How to avoid:
- State: Ideally, your application should be stateless. If this is not possible, use external, shared state stores (Redis, Memcached) or databases that both application versions can access.
- Database: All migrations must be backward compatible. This means that the new application version must be able to work with the old DB schema, and the old version must be able to work with the new DB schema (until it is decommissioned). Use two-phase migrations for complex schema changes. Always perform backups before migration.
Example of consequences: After a Blue/Green deployment, users who were on the "blue" environment lose their sessions when switching to "green." Or the new version tries to use a non-existent column in the DB, and the old version cannot work with the new schema, leading to complete application unavailability.
7.4. Lack of or Complexity in Rollback Automation
Description of the mistake: In theory, rollback in Blue/Green and Canary is simple. In practice, if the rollback process is not automated and tested, it can be slow, error-prone, and lead to additional downtime. Sometimes teams focus only on deployment, forgetting the importance of fast and reliable rollback.
How to avoid: Include the rollback process in your CI/CD pipeline. It should be as automated and tested as the deployment process. For Blue/Green, this is simply switching the load balancer. For Canary, this might be automatically reducing traffic to the "canary" to zero upon detection of critical metrics or errors. Regularly test the rollback procedure in a test environment.
Example of consequences: A critical error is discovered in the new version. The team tries to manually roll back Nginx but makes a configuration error, leading to additional downtime. Or the rollback takes 15 minutes instead of 15 seconds.
7.5. Ignoring Cleanup of Old Resources
Description of the mistake: Particularly relevant for Blue/Green. After a successful deployment and transition to the "green" environment, the "blue" environment often remains running, consuming valuable VPS resources. If this is not monitored and automated, over time it leads to significant overspending and inefficient infrastructure utilization.
How to avoid: Include a cleanup stage for old resources (stopping and deleting old containers/services) in your CI/CD pipeline. Make it either automatic after a certain period of stable operation of the new version, or manual but with a clear reminder. For Canary, ensure that "canary" instances are decommissioned after the full rollout of the new version.
Example of consequences: After several months, it turns out that 5-6 old versions of the application are running on the VPS, consuming CPU and RAM, which leads to slowdowns in the active application and unjustified VPS costs.
7.6. Incorrect Load Balancer Configuration
Description of the mistake: The load balancer (Nginx, HAProxy, Caddy, Traefik) is a key component of both strategies. Errors in its configuration can lead to incorrect traffic routing, session leaks, or even DoS attacks on the inactive environment. For example, incorrect proxy header settings can cause the application not to see the user's real IP.
How to avoid: Carefully check your load balancer configuration. Use health checks to verify backend availability. Ensure that sticky sessions (if needed) are configured correctly. Automate configuration changes via CI/CD. Use tools like nginx -t to check syntax before reloading.
Example of consequences: Users see the old version of the application, even though traffic should have been switched to the new one. Or requests are distributed unevenly, causing an overload on one of the environments. In Canary, incorrect routing can lead to the "canary" being seen by many more users than planned, or it not receiving any traffic at all.
By avoiding these common mistakes, you will significantly increase the chances of successful implementation and effective use of Blue/Green and Canary deployment strategies, ensuring the stability and reliability of your Docker applications on a VPS.
8. Checklist for Practical Application
Before starting the implementation or a new deployment using Blue/Green or Canary strategies, go through this checklist. It will help ensure that you have considered all critical aspects and minimized risks. This checklist is relevant for 2026, taking into account modern DevOps practices.
8.1. General Preparation and Planning
- Acceptable downtime defined: You know what level of downtime is acceptable for your application and target audience.
- Deployment strategy chosen: Blue/Green or Canary, based on business needs and technical capabilities.
- VPS resources are sufficient: Availability of CPU, RAM, disk checked for simultaneous operation of two versions (Blue/Green) or stable and Canary versions.
- Rollback plan ready and tested: You know how to quickly and safely revert to the previous stable version.
- DB migration plan ready: All DB changes are designed with backward compatibility in mind.
- Team informed: All process participants (developers, testers, DevOps) know their roles and deployment stages.
- Deployment schedule agreed upon: The least busy time for deployment has been chosen to minimize impact on users.
8.2. Infrastructure and Tool Preparation
- Docker and Docker Compose installed and configured: Ready for use on your VPS.
- Load balancer configured: Nginx, Caddy, or HAProxy are ready to manage traffic.
- CI/CD pipeline configured: Jenkins, GitLab CI, GitHub Actions, or Ansible automate build, testing, and deployment.
- Passwordless SSH access: An SSH key is configured for the CI/CD agent for secure access to the VPS.
- Monitoring system configured: Prometheus + Grafana collect infrastructure and application metrics.
- Logging system configured: ELK stack or Loki + Promtail collect and aggregate logs from all containers.
- Alerts configured and tested: Notifications about critical issues arrive in real-time.
- DB backups performed: Fresh database backups made before starting the deployment.
8.3. Application and Code Preparation
- Application Docker image optimized: Minimal size, multi-layer cache, absence of unnecessary dependencies.
- Health checks implemented: The application provides an endpoint (e.g.,
/health) that the load balancer can use to check its health.
- Application metrics exposed: The application provides metrics for Prometheus (e.g., via a client library).
- Logging standardized: The application logs to stdout/stderr in a parse-friendly format (e.g., JSON).
- Application configuration parameterized: All sensitive data and environment-specific parameters are loaded from environment variables or configuration files, not hardcoded into the image.
- Tests passed: All automated tests (unit, integration, E2E) have successfully passed in the test environment.
- API/contract backward compatibility: Ensure that the new version does not break clients using the old API.
8.4. Deployment Stages
- Old version (Blue) is stable: The state of the current application version has been checked.
- New version (Green/Canary) deployed: Containers of the new version successfully launched on the VPS, but traffic has not yet been directed to them.
- Testing the new version (before traffic switch): Manual and automated tests performed on Green/Canary without affecting main users.
- Traffic switch:
- Blue/Green: Load balancer switched to Green.
- Canary: Load balancer starts directing a small percentage of traffic to Canary.
- Monitoring after switch: Metrics and logs of the new version are actively monitored.
- Decision making:
- Blue/Green: If Green is stable, Blue can be stopped. If problems, roll back to Blue.
- Canary: If Canary is stable, gradually increase traffic percentage. If problems, roll back Canary.
- Resource cleanup: Old containers and images deleted to free up VPS resources.
By following this checklist, you will significantly increase the likelihood of a successful and trouble-free deployment, ensuring high availability and reliability for your Docker applications.
9. Cost Calculation / Economics of Implementation
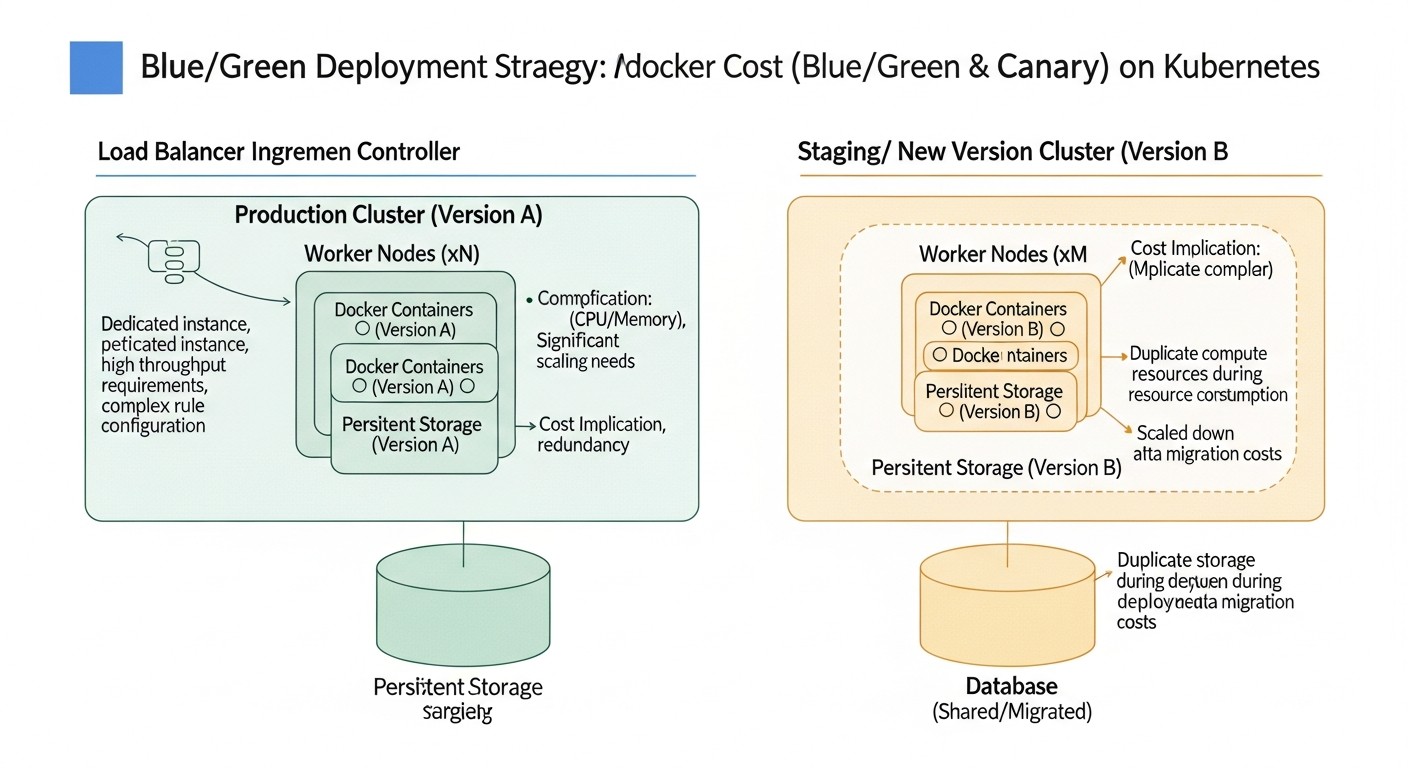 Diagram: 9. Cost Calculation / Economics of Implementation
Implementing advanced deployment strategies, such as Blue/Green and Canary, on a VPS always involves certain costs. It's important to understand that these costs are not limited to the VPS cost itself but also include hidden expenses and potential savings. In 2026, as the cost of cloud resources continues to optimize and automation becomes more accessible, a proper economic calculation can provide a significant competitive advantage.
9.1. Direct VPS Costs
The main expense is the virtual server itself. VPS prices in 2026 continue to decrease, especially for standard configurations. For Docker applications on a medium-power VPS (4 vCPU, 8GB RAM, 160GB SSD), you can expect the following approximate monthly rates from leading providers (DigitalOcean, Vultr, Hetzner, Linode):
- Basic VPS: $15 - $25 / month
- Medium VPS: $30 - $50 / month
- Powerful VPS: $60 - $100+ / month
9.1.1. Blue/Green Scenario: Temporary Resource Doubling
For a Blue/Green strategy, you will need to temporarily double your resources. If your application typically runs on one VPS for $40/month, then during deployment, you will need a second identical VPS (or its resource equivalent). Let's assume deployment takes 30 minutes.
- Monthly cost of one VPS: $40
- Cost per hour of VPS operation: $40 / (30 days 24 hours) = ~$0.055 / hour
- Additional deployment costs (30 minutes): $0.055 / 2 = ~$0.0275 per deployment.
- If you deploy 4 times a month: 4 $0.0275 = ~$0.11
As you can see, the direct additional VPS costs for Blue/Green are extremely small if you use temporary scaling or have spare resources on an existing server. The main thing to pay attention to is the mistake of ignoring old resource cleanup, which can lead to continuous unnecessary expenses.
9.1.2. Canary Scenario: Constantly Increased Resources
For Canary deployments, you often keep "canary" instances running constantly, even if they serve a small percentage of traffic. This can mean you consistently need 10-50% more resources than for a single stable version.
- Monthly cost of one VPS: $40
- Additional resources for Canary: For example, 20% of one VPS.
- Constant additional expenses: $40 0.20 = $8/month.
These costs can be higher if Canary instances require a separate VPS or if you use more complex routing that might consume additional load balancer resources.
9.2. Hidden Costs
Beyond direct VPS costs, there are hidden expenses that are often overlooked but can be quite significant.
- Engineer time: The biggest hidden cost. Setting up and maintaining CI/CD pipelines, monitoring systems, troubleshooting problems. In 2026, the average DevOps engineer rate is $80-150/hour. If setup takes 80 hours: 80 $100 = $8000.
- Tool costs: Although many tools (Docker, Nginx, Prometheus, Grafana) are free, some may have paid versions or require paid hosting (e.g., GitLab EE, cloud logging solutions).
- Team training: Investment in training engineers on new strategies and tools.
- Potential losses from errors: Despite risk reduction, errors can still occur. Loss of customers, reputational damage, penalties for SLA violations.
9.3. How to Optimize Costs
- Efficient use of VPS resources:
- Docker image optimization: Reducing image size, using multi-stage builds.
- Docker Compose optimization: Using external networks, intelligent volume management.
- Load monitoring: Choosing a VPS that precisely matches your needs, rather than "with a reserve."
- Automation: Investing in CI/CD pipelines reduces manual labor and minimizes errors, which saves engineer time in the long run.
- Thorough DB planning: Minimizing complex migrations that can lead to downtime or manual intervention.
- Using free and Open-Source tools: Maximizing the use of the Open-Source ecosystem (Nginx, Docker, Prometheus, Grafana, Ansible, GitLab CE/GitHub Actions).
- Regular resource audit: Periodically check which containers and services are running on your VPS and remove unused ones.
9.4. Table with Calculation Examples for Different Scenarios (2026)
Assume that a basic VPS, sufficient for one version of the application, costs $40/month.
| Parameter |
Scenario 1: Blue/Green (1 deploy/week) |
Scenario 2: Canary (20% traffic constantly on Canary) |
Scenario 3: Without Advanced Strategies (simple deploy with 5 min downtime) |
| Direct VPS Costs |
$40 (main) + $0.11 (additional hours) = $40.11/month |
$40 (main) + $8 (additional resources) = $48/month |
$40/month |
| Engineer Time Cost (setup) |
~80 hours $100 = $8000 (one-time) |
~120 hours $100 = $12000 (one-time) |
~20 hours $100 = $2000 (one-time) |
| Engineer Time Cost (support) |
~5 hours/month $100 = $500/month |
~8 hours/month $100 = $800/month |
~2 hours/month $100 = $200/month |
| Losses from Downtime (example) |
$0 (almost zero) |
$0 (almost zero) |
$100/min 5 min 4 deploys = $2000/month |
| Risk of Reputational Loss |
Low |
Very Low (limited audience) |
High |
| Total Cost of Ownership (TCO) per year |
$8000 (setup) + $40.1112 (VPS) + $50012 (support) = ~$14500 |
$12000 (setup) + $4812 (VPS) + $80012 (support) = ~$22600 |
$2000 (setup) + $4012 (VPS) + $20012 (support) + $200012 (losses) = ~$29000 |
This table clearly demonstrates that while the initial investments in Blue/Green and Canary deployments are higher, they pay off by reducing downtime losses, minimizing manual operations, and increasing reliability. For mission-critical applications where every minute of downtime costs money, these advanced strategies are not just desirable but economically justified investments.
10. Real-world Cases and Examples
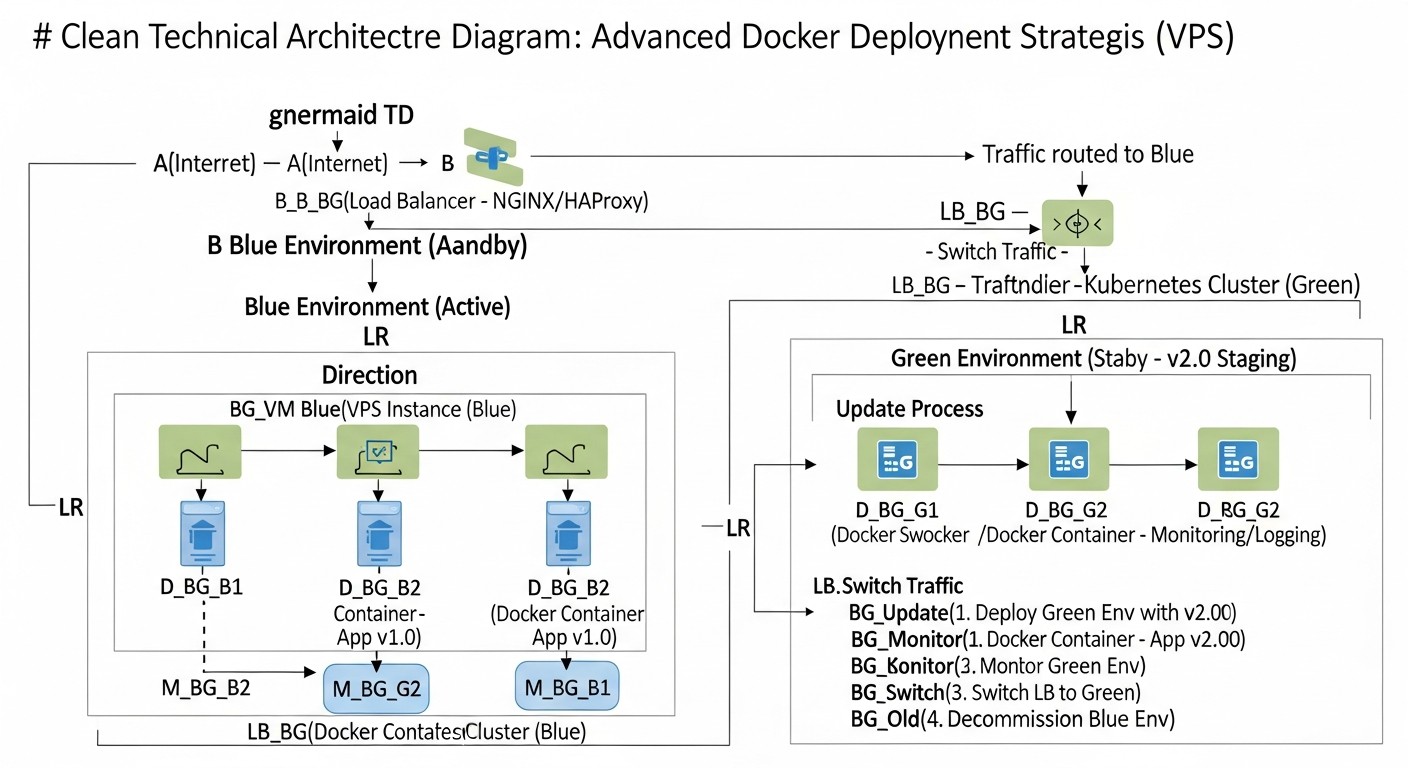 Diagram: 10. Real-world Cases and Examples
To better understand how Blue/Green and Canary deployments are applied in practice, let's consider several realistic scenarios. These cases demonstrate how various companies can use these strategies to solve their unique challenges on a VPS.
10.1. Case 1: SaaS Project Management Platform (Blue/Green)
Scenario
A small but rapidly growing SaaS company "TaskFlow" provides a project management platform. They have about 5000 active clients who use the service 24/7. The development team (4 Node.js backend developers) releases new features and bug fixes weekly. Service downtime, even for 5 minutes, leads to client complaints and potential subscription loss. The infrastructure consists of a single powerful VPS (8 vCPU, 16GB RAM) with Docker Compose, Nginx as a reverse proxy, and PostgreSQL.
Problem
Traditional "stop-replace-start" deployment led to 2-5 minutes of downtime every week. This caused client dissatisfaction, especially from different time zones, and increased the load on support.
Solution: Implementing Blue/Green Deployment
- Container Duplication: Instead of one set of containers for the Node.js application, two sets were created:
taskflow-blue and taskflow-green, each on its own port (e.g., 3000 and 3001).
- Shared Database: PostgreSQL remained unified, but DB migrations were carefully designed for backward compatibility.
- Nginx as a Switch: Nginx was configured to route all traffic to port 3000 (Blue).
- CI/CD Pipeline: GitLab CI was configured to:
- Build a new Docker image.
- Deploy the new version to port 3001 (Green).
- Run automated integration tests against the Green environment.
- After successful testing, await manual confirmation.
- Upon engineer's command, automatically change Nginx configuration to switch traffic to port 3001 and reload Nginx.
- After confirming Green's stability, stop and remove Blue containers.
- Monitoring: Prometheus and Grafana were configured to track metrics for both environments, with alerting to Slack upon an increase in errors or delays.
Results
- Zero Downtime: Traffic switching time was reduced to 1-2 seconds, completely eliminating downtime.
- Fast Rollback: In case of issues, rollback took less than 10 seconds.
- Increased Client Trust: The number of complaints about service unavailability sharply decreased.
- Team Confidence: Developers became more confident in releasing new features, knowing that the risk was minimal.
- Additional Costs: Minimal, as the VPS had sufficient resource headroom for temporary doubling of load, and engineer time for setup paid off within 3 months due to reduced manual operations and downtime.
10.2. Case 2: High-Load E-commerce Platform (Canary)
Scenario
A large E-commerce platform "ShopSphere" (on PHP/Laravel) has tens of thousands of active users daily. Their VPS infrastructure consists of several powerful servers combined into a cluster with HAProxy as a load balancer. Introducing new features, especially in the payment system or shopping cart, carries high risks. Even 0.1% errors can lead to significant financial losses. The team wants to test new features on real users before rolling them out to everyone.
Problem
Blue/Green was good for downtime, but it did not provide the ability to test new features on a small, representative sample of real users. Sometimes new features worked perfectly in the test environment but caused unexpected behavior or errors in production due to the specifics of user data or usage patterns.
Solution: Implementing Canary Deployment
- Canary Instance Allocation: Resources were allocated on one of the VPS for running the "canary" version of the application (
shopsphere-canary).
- HAProxy for Traffic Routing: HAProxy was configured to redirect traffic:
- Initially, 99.5% of traffic went to stable (Blue) instances.
- 0.5% of traffic was directed to the Canary instance. This was implemented using weights in the HAProxy configuration.
- For internal testers, routing was provided via a special HTTP header
X-Test-Version: canary.
- Advanced Monitoring: In addition to Prometheus/Grafana, an ELK stack was implemented for deep log analysis. Special attention was paid to business metrics (conversion, average check) for the Canary group compared to the Blue group.
- Automated Pipeline with Manual Steps: GitLab CI was configured for:
- Building and deploying the Canary version.
- Automatically running smoke tests.
- Manual "Canary 0.5% Evaluation" step: the team analyzed metrics and logs for 4-6 hours.
- If all was well, a manual "Increase to 5%" step.
- Repeating monitoring and increase (25%, 50%, 100%).
- Automatic Canary rollback upon detection of critical anomalies (e.g., sharp increase in 5xx errors, drop in conversion).
Results
- Minimal Risk: Critical errors were identified on a very small sample of users, preventing widespread problems.
- Release Quality: New features were thoroughly tested in real-world conditions, significantly improving the quality and stability of releases.
- User Experience Optimization: Ability to conduct A/B testing of new features and UI changes on a small audience, gathering real feedback.
- Additional Costs: Continuous use of one additional VPS for Canary instances ($40/month) and significant investment in setting up and supporting a complex pipeline and monitoring (approximately 120 engineer hours). However, these costs are fully justified by preventing multi-million dollar losses from E-commerce errors.
These cases show that Blue/Green and Canary deployments are not just theoretical concepts, but powerful, battle-tested strategies capable of significantly improving the development and operation process of applications on a VPS, while ensuring high availability and service quality.
12. Troubleshooting: Solving Common Problems
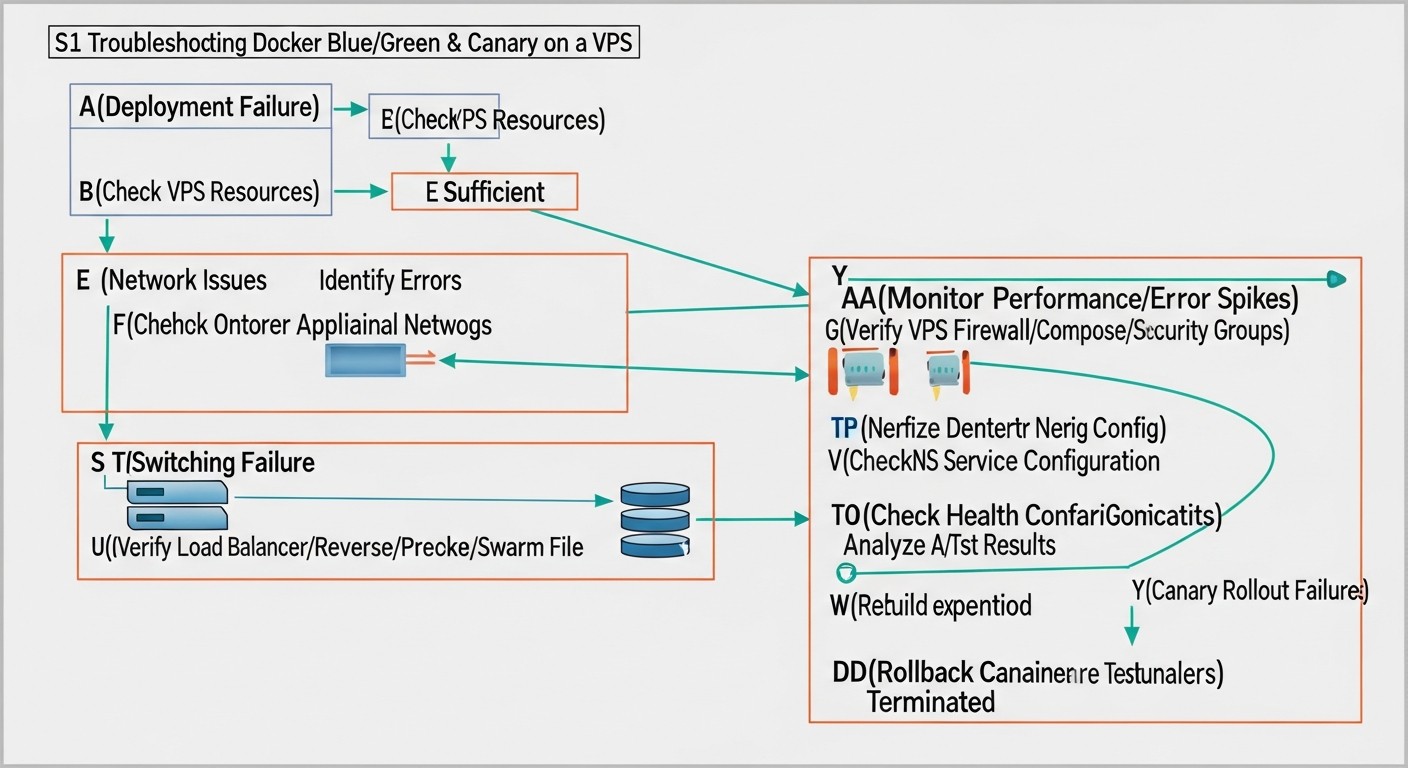 Diagram: 12. Troubleshooting: Solving Common Problems
Even with the most thorough preparation and the use of advanced deployment strategies, problems can arise in production. The ability to quickly diagnose and resolve them is a key skill for any DevOps engineer. In this section, we will look at common problems that can occur during Blue/Green and Canary deployments on a VPS with Docker, and offer specific steps for their resolution.
12.1. Problem: New Application Version (Green/Canary) Fails to Start or Crashes Immediately After Launch
Symptoms
- The container does not start or constantly restarts.
- Errors in Docker or application logs.
- Health check endpoint is unreachable.
Diagnostic Commands
# Check container status
docker ps -a | grep

# View container logs
docker logs

# Enter the container for manual inspection
docker exec -it  /bin/bash
Solutions
- Check logs: This is the first and most important step. Look for error messages, exceptions, issues with dependencies, environment variables, connection to the DB, or external services.
- Resource shortage: Check CPU/RAM usage on the VPS. The new version might consume more resources than expected, and Docker cannot allocate enough.
htop # Or top, free -h
docker stats
- Configuration problems: Ensure that all environment variables, configuration files, and mounted volumes are correct for the new version.
- Ports occupied: Make sure that the port on which the new version should run is not occupied by another process.
sudo netstat -tulnp | grep
- Errors in Dockerfile/image: If the new version does not build or run correctly, check the
Dockerfile and the build process.
12.2. Problem: Traffic Does Not Switch to the New Version or Switches Incorrectly
Symptoms
- Users continue to see the old version, although traffic should logically have been switched.
- Some users see the old version, some see the new (for Blue/Green).
- For Canary: traffic percentage does not match expectations.
Diagnostic Commands
# Check Nginx configuration
sudo nginx -t
sudo cat /etc/nginx/nginx.conf

# Check Nginx logs
sudo tail -f /var/log/nginx/access.log
sudo tail -f /var/log/nginx/error.log

# Check application port availability
curl http://127.0.0.1:8080/health # Blue
curl http://127.0.0.1:8081/health # Green/Canary
Solutions
- Check load balancer configuration: Ensure that changes in
nginx.conf (or Caddyfile/HAProxy) have been applied and the syntax is correct. Reload or re-read the configuration.
- Check health checks: The load balancer might have marked the new version as "unhealthy" and is not directing traffic to it. Check the load balancer logs.
- DNS caching: If you are switching traffic via DNS, changes may propagate slowly due to caching. This does not apply to Nginx/HAProxy, which operate at the L7 level.
- Sticky sessions: If sticky sessions are used, ensure they are correctly configured and do not interfere with traffic switching.
12.3. Problem: New Version Runs Slower or Generates More Errors
Symptoms
- Increase in error metrics (5xx) in Prometheus/Grafana for the new version.
- Increased response latency.
- Increased CPU/RAM consumption for new version containers.
- User complaints about slow performance or unavailability.
Diagnostic Commands
# Monitor metrics in Grafana
# Analyze logs in Loki/Kibana
docker stats  # Compare with docker stats
Solutions
- Monitoring and logs: These are your primary points of reference. Compare metrics and logs of the new and old versions. Look for anomalies: new error types, increased execution time for DB queries, external APIs.
- Resources: Ensure that the new version is not hitting CPU/RAM limits on the VPS. It might require more resources.
- DB issues: Check for slow database queries, indexing problems, or deadlocks caused by changes in the new version.
- External dependencies: The new version might have issues connecting to external services, caches, message queues.
- Rollback: If the problem is critical and a quick solution is not found, immediately roll back to the previous stable version.
12.4. Problem: Database Migration Issues
Symptoms
- Application errors related to DB access (e.g., "column not found", "table not found").
- Data corruption or inconsistency.
Diagnostic Commands
# Check migration logs
# Connect to DB and check schema
psql -U user -d mydatabase -h db -c "\dt"
psql -U user -d mydatabase -h db -c "\d "
Solutions
- Backward compatibility: Ensure that migrations were designed with backward compatibility in mind. Both application versions (old and new) must be able to work with the DB during the transition period.
- Migration order: Ensure that migrations are executed in the correct order: first, changes compatible with the old version, then deploy the new version, then, if necessary, remove old elements.
- Backups: Always make DB backups before deployment and migration. In case of serious problems, this will allow data recovery.
- Testing migrations: Test migrations not only on test data but also on a copy of the production DB.
12.5. When to Contact Support
If you encounter problems that you cannot solve on your own, or if you have difficulties with the VPS infrastructure itself:
- VPS problems: Server unavailability, network issues, disk problems that are not related to your application.
- Provider problems: If you suspect that the problem is on the hosting provider's side (e.g., general region unavailability, network issues).
- Unknown errors: If logs do not provide a clear understanding of the problem, and all standard diagnostic steps have not yielded results.
Provide support with the most complete information possible: the exact time the problem occurred, logs, metrics, diagnostic steps performed, and any changes you made before the problem arose.
13. FAQ: Frequently Asked Questions
What is Blue/Green Deployment?
Blue/Green deployment is a deployment strategy where two identical production environments are maintained: "Blue" with the current stable application version and "Green" for the new version. All user traffic is directed to one of them. During an update, the new version is deployed to the "Green" environment, tested, and then traffic is instantly switched from "Blue" to "Green". This ensures virtually zero downtime and a quick rollback.
What is the main difference between Blue/Green and Canary deployment?
The main difference lies in the method of traffic switching. Blue/Green switches all traffic to the new version instantaneously after full testing. Canary deployment, on the other hand, gradually directs a small percentage of traffic to the new version, allowing it to be tested on real users and metrics to be collected before a full rollout. Canary minimizes risks but is more complex to implement and takes longer.
Can Blue/Green or Canary be implemented on a single VPS?
Yes, it is entirely possible, especially for applications of medium complexity. This requires sufficient resources on the VPS (CPU, RAM) to run multiple versions of your Docker application simultaneously. Different ports are used for each version, and a load balancer (Nginx, HAProxy) is used for traffic routing. Docker Compose helps manage multiple sets of containers on a single host.
What tools are needed for Blue/Green/Canary on a VPS?
You will need: Docker and Docker Compose for containerization and orchestration, a load balancer (Nginx, Caddy, HAProxy) for traffic routing, a CI/CD system (GitLab CI, GitHub Actions, Jenkins, Ansible) for deployment automation, as well as monitoring systems (Prometheus, Grafana) and logging (Loki, Promtail, ELK stack) to control the state of both application versions.
How to handle databases and their migrations with this type of deployment?
Database management is a critical aspect. All DB migrations must be backward compatible so that both the old and new application versions can work with the same DB schema during the transition period. Use two-phase migrations for complex changes. Always make backups before migration. Ideally, the application should be designed so that DB schema changes are minimal and non-blocking.
How much do VPS costs increase when using these strategies?
For Blue/Green, VPS costs temporarily increase (during deployment) by the cost of duplicating resources. If you have spare capacity on your VPS, this can be very cheap. For Canary, continuously additional resources (e.g., 10-50% of current load) may be required to maintain Canary instances. However, these direct costs are often offset by reduced losses from downtime and errors, ultimately making these strategies economically viable.
What are the risks associated with Blue/Green deployment?
Key risks include: the need to double resources during deployment, the complexity of managing application state (sessions, caches) during switching, and the need for careful planning of database migrations. If the "Green" environment is poorly tested, switching to it can lead to a complete service outage for all users.
What are the risks associated with Canary deployment?
Canary deployment is more complex to implement, requiring an advanced monitoring system and traffic routing. There is a risk that a small group of users will encounter errors before the problem is detected. The deployment process can take longer. State and DB management are even more critical, as both application versions run in parallel for an extended period.
How to automate traffic switching for Blue/Green/Canary?
Traffic switching automation is typically performed via a CI/CD pipeline. Scripts (e.g., Ansible, Bash scripts called from GitLab CI/GitHub Actions) can modify load balancer configurations (Nginx, HAProxy), reload them, or update DNS records. For Canary, this might involve gradually changing weights in the load balancer configuration.
What is a Health Check and why is it important?
A Health Check is a special endpoint (e.g., /health) in your application that the load balancer or monitoring system regularly polls. If the endpoint returns a 200 OK code, the application is considered healthy; otherwise, it's unhealthy. A Health Check is critically important because it allows the load balancer to automatically exclude faulty instances from the pool and ensure that traffic is directed only to working application versions.
14. Conclusion
In a world where the speed of change and continuous service availability have become not just a competitive advantage, but a basic requirement, traditional approaches to deploying Docker applications on a VPS are no longer sufficient. Blue/Green and Canary update strategies offer powerful solutions for these challenges, allowing you to minimize downtime, reduce risks, and significantly improve the quality of your releases.
We have thoroughly examined both strategies, their operating principles, advantages, and disadvantages, as well as specific implementation examples using current tools for 2026. Blue/Green deployment is ideal for projects where zero downtime and fast rollback are critical, and temporary doubling of resources is acceptable. It is relatively easy to learn and implement on a VPS using Docker Compose and Nginx. Canary deployment, though more complex, provides unprecedented opportunities for testing new features on real users, minimizing risks to an absolute minimum, which is especially valuable for large and mission-critical SaaS projects.
Regardless of the chosen strategy, the key success factors are:
- Automation: An end-to-end CI/CD pipeline, automating build, testing, deployment, and rollback.
- Monitoring and Logging: A deep understanding of your application and infrastructure status in real-time.
- Thorough Planning: Special attention to database migrations, state management, and testing.
- DevOps Culture: Collaboration between developers and operations engineers to ensure seamless operation.
Next Steps for the Reader
- Assess your current needs: Analyze your project's acceptable downtime, risks, and resources.
- Start small: If you are a beginner, try implementing a basic Blue/Green deployment on a test VPS with a simple Docker application.
- Invest in automation: Start by setting up a simple CI/CD pipeline for building and deployment.
- Implement monitoring: Even basic Prometheus and Grafana will provide you with invaluable information.
- Study the tools: Dive deeper into the documentation for Nginx/HAProxy, Ansible, GitLab CI/GitHub Actions.
- Practice: Experience comes with practice. Don't be afraid to experiment in a controlled environment.
Implementing these advanced strategies is not just a technical exercise, but an investment in the stability, reliability, and competitiveness of your product. In 2026, this is no longer a luxury, but a necessity for any serious SaaS project or online service striving for excellence.
Was this guide helpful?
Advanced strategies for Docker application deployment on VPS: blue/green and canary updates
support_agent
Valebyte Support
Usually replies within minutes
Hi there!
Send us a message and we'll reply as soon as possible.