How to Check the Load on Your VPS?
If you want to know how loaded your Virtual Private Server (VPS) is, you need to monitor its load. The load on your VPS can affect the performance of your website or application, so it’s important to know how to measure and control it.
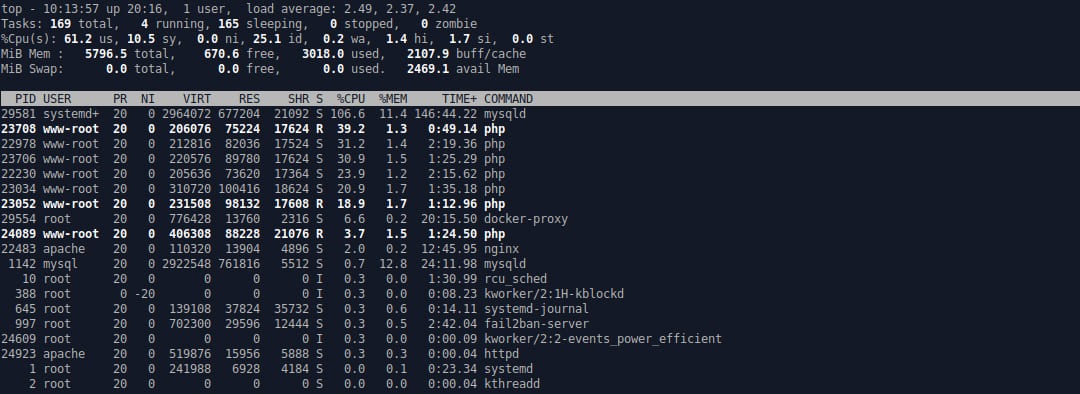
There are several ways to check the load on your VPS. One of the easiest ways is to use the top utility. top shows the current load on the processor, memory, and disk subsystem. To use the top utility, you need to execute the following command:
top
After executing this command, you will see a list of processes running on your VPS, as well as the current load on various resources. The first line of the output shows the overall system load.
If you need more detailed information about the server load, you can use the vmstat utility. Vmstat shows statistics on the use of system resources, such as the processor, memory, disks, and network. To use the vmstat utility, execute the following command:
vmstat
After executing this command, you will see detailed statistics on the resource usage of your server. This will help you identify bottlenecks and optimize the performance of your VPS.
If you want to automate VPS load monitoring, you can use utilities like Nagios or Zabbix. They provide the ability to configure notifications when certain load thresholds are exceeded, which helps to respond quickly to problems.
It is important to remember that you need to check the load on your VPS not only when problems arise, but also on a regular basis to prevent them from occurring. Monitor the load on your server and ensure its stable operation!