How to Check Disk I/O Load in Linux?
In the Linux operating system, you can easily track disk I/O load using various utilities and commands. This is very useful for monitoring your server’s performance and optimizing its efficiency. In this article, we will look at several methods that will help you find out how heavily your system’s disk is being used.
1. Using the iostat Command
The iostat command helps you get information about the current disk I/O load. To do this, simply run the following command:
iostat
You will see disk statistics, including average wait time (await), throughput (tps), the number of read/write operations per second (r/s, w/s), and other parameters.
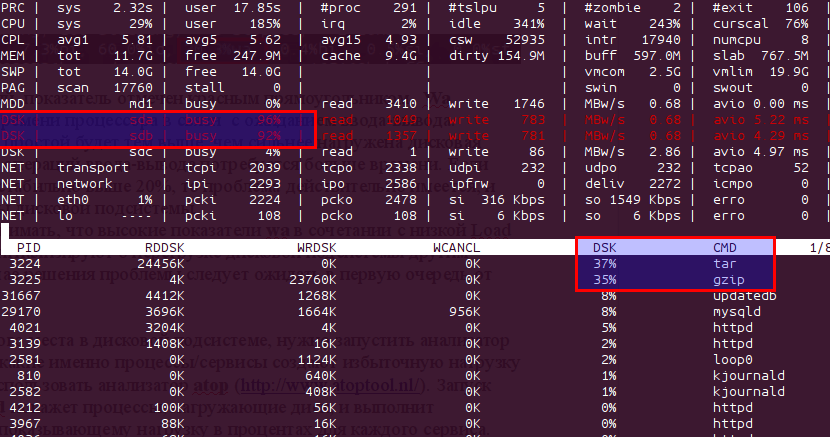
2. Using the iotop Command
For a more detailed analysis of disk I/O load, you can use the iotop command. This utility allows you to track the processes that are most actively accessing the disk. To run iotop, execute the following command:
sudo iotop
After that, you will see a list of processes, sorted by their level of I/O activity.
3. Using the lsof Command
Another useful tool for analyzing disk load is the lsof command. It allows you to see which files are currently open by processes. To do this, run the command:
lsof
You will get a list of files that are open by each process, and you will also see on which devices they are located.
Conclusion
Tracking disk I/O load is important for optimizing system performance. By using the commands mentioned above, you can quickly identify disk problems and take steps to resolve them. Remember that effective disk management will help you improve your server’s performance and increase its reliability.
We hope this article was helpful to you. Follow US servers to learn more interesting topics about Linux and system administration!

![How to Set Up Automated VDS Backups in [Platform/Location]](https://valebyte.com/blog/wp-content/uploads/2025/11/leonardo_3b4910a9-300x169.jpg)