VPS Monitoring: Prometheus, Grafana, and Alertmanager in Practice in 2026
TL;DR
- Comprehensive VPS monitoring using the Prometheus, Grafana, and Alertmanager stack is an industry standard in 2026, providing deep insight into server status and automated response.
- Prometheus collects metrics using a pull model and the powerful PromQL query language, allowing for highly detailed data aggregation and analysis.
- Grafana transforms raw metrics into intuitive dashboards, making information accessible and understandable for all team members, from engineers to founders.
- Alertmanager centrally manages alerts, ensuring their grouping, deduplication, inhibition, and routing to various channels (Slack, Telegram, email, PagerDuty).
- For effective VPS monitoring, it is critically important to track CPU, RAM, disk I/O, network activity, and specific application metrics using Node Exporter and other exporters.
- Cost optimization is achieved by choosing the right hosting, efficient Prometheus data storage, and deployment automation, while not compromising on the fault tolerance of the monitoring system.
- Regular alert testing, dashboard updates, and a deep understanding of PromQL are key success factors for stable operation of production systems.
1. Introduction: Why VPS Monitoring is Critical in 2026
In the rapidly evolving world of information technology, where server downtime is measured not only in lost money but also in reputational risks, high-quality Virtual Private Server (VPS) monitoring becomes not just desirable, but an absolute necessity. By 2026, when microservice architecture and cloud computing have become a ubiquitous standard, and user expectations for service availability have approached 100%, ignoring monitoring is equivalent to flying a plane blind. This is especially relevant for startups and SaaS projects, where every hour of service operation directly impacts business metrics and customer loyalty.
This article is addressed to a wide range of technical specialists: DevOps engineers who build and maintain infrastructure; Backend developers in Python, Node.js, Go, PHP, striving to understand the behavior of their applications in production; SaaS project founders for whom service stability is key to survival; system administrators responsible for uninterrupted server operation; and startup CTOs who make strategic decisions on the technology stack. We will explore how the combination of three powerful and open-source tools — Prometheus for metric collection, Grafana for their visualization, and Alertmanager for alert management — allows for the creation of a reliable, scalable, and cost-effective monitoring system for any VPS.
We will not sell you "magic pills" or "revolutionary methods." Instead, we will focus on practical aspects: how to install, configure, maintain, and optimize this system, avoiding common mistakes and relying on real-world experience. You will learn which metrics are truly important, how to interpret them correctly, how to set up smart alerts that won't spam, and how to use monitoring data to make informed decisions, whether it's scaling infrastructure or optimizing code. By the end of the article, you will have a complete understanding of how to build and maintain a monitoring system that will serve you faithfully in the constantly changing demands of 2026.
2. Key Criteria for Effective VPS Monitoring
Effective VPS monitoring is not just about collecting any available data. It is a targeted process focused on key metrics that directly impact the performance, stability, and availability of your services. In 2026, as VPS resources have become more flexible and powerful, but also the demands on their utilization have increased, understanding these criteria becomes even more important.
2.1. CPU Utilization
CPU metrics are the first thing to look at when diagnosing problems. High CPU utilization can indicate resource-intensive processes, infinite loops, inefficient code, or DDoS attacks. It is important to track not only overall utilization (node_cpu_seconds_total with various modes: idle, user, system, iowait, steal) but also Load Average (node_load1, node_load5, node_load15) — the average number of processes waiting to run.
idle: Time when the CPU is idle. A low value indicates high utilization.user: Time when the CPU is executing user processes.system: Time when the CPU is executing system processes (kernel).iowait: Time when the CPU is waiting for I/O operations to complete. Highiowaitoften signals disk or network issues, rather than CPU itself.steal: (for virtual machines) Time when the virtual machine is waiting for the hypervisor to allocate real CPU. Highstealcan indicate an overloaded host machine.
It is necessary to evaluate not only peak values but also trends. For example, a constantly rising load average with stable user and system can indicate a problem with locks or resource scarcity.
2.2. RAM Usage
Lack of RAM leads to swap usage, which significantly slows down server operation, as disk operations are much slower than RAM operations. RAM monitoring includes: total memory, free memory, used memory, buffers, and cache (node_memory_MemTotal_bytes, node_memory_MemFree_bytes, node_memory_Buffers_bytes, node_memory_Cached_bytes, node_memory_SwapTotal_bytes, node_memory_SwapFree_bytes). It is important to remember that Linux actively uses free memory for caching, so a low MemFree value does not always mean a problem if Buffers and Cached are high.
Key indicators: percentage of RAM used excluding cache, percentage of swap used. Constant swap usage is a clear sign that the VPS needs more RAM or that application memory consumption needs optimization.
2.3. Disk I/O
The disk subsystem often becomes a bottleneck, especially for databases, file storage, or applications with intensive write/read operations. Metrics to track: read/write speed (node_disk_read_bytes_total, node_disk_written_bytes_total), number of read/write operations per second (IOPS), latency, disk utilization (node_disk_io_time_seconds_total). High CPU iowait, as mentioned, often correlates with disk I/O problems.
It is important to distinguish between speed (MB/s) and number of operations (IOPS), as different metrics are important for different tasks. For example, IOPS are critical for a database, while speed is critical for a file server.
2.4. Network Activity
Network monitoring includes tracking incoming and outgoing traffic (node_network_receive_bytes_total, node_network_transmit_bytes_total), packets per second (PPS), errors, and dropped packets (node_network_receive_errs_total, node_network_drop_total). Traffic spikes can be normal (e.g., during backups or large downloads), but abnormally high outgoing traffic without apparent reasons can indicate server compromise or a DDoS attack originating from your VPS.
Low bandwidth or a high percentage of errors can signal problems at the network interface, cable, switch, or even on the VPS provider's side. In 2026, when most VPS come with high-speed network interfaces (10 Gbit/s and above), it is important to ensure that your application uses this resource efficiently.
2.5. Running Processes and Their State
The number of running processes (node_procs_running, node_procs_total) and their state (sleeping, zombie, uninterruptible) are also important indicators. An abnormally large number of processes, especially zombie processes (node_procs_zombie), can indicate problems with the application or operating system. Monitoring specific processes, such as your web server (Nginx, Apache), database (PostgreSQL, MySQL), or backend application, for their availability and resource consumption (CPU, RAM) is critically important.
For deeper process analysis, tools like cAdvisor for containers or specialized exporters that provide metrics per process or group of processes can be used.
2.6. Application Performance and Availability
Infrastructure monitoring without application monitoring is a half-measure. Your applications are what bring value to users. Application metrics can include: requests per second (RPS), response time (latency), number of errors (HTTP 5xx), number of active users, message queue status, number of open database connections. These metrics are often collected using special exporters (e.g., Nginx exporter, MySQL exporter, Redis exporter) or directly from the application code using Prometheus client libraries.
In 2026, as API-driven approaches and microservices dominate, tracking end-to-end transactions and latencies between services becomes key to quickly identifying the source of a problem.
2.7. Free Disk Space
Disk full is one of the most common causes of service failures. Monitoring free space (node_filesystem_avail_bytes, node_filesystem_size_bytes) on all critical file systems (/, /var, /var/log, /home, /opt) should be configured with alerts at multiple levels (e.g., warning at 80% full, critical at 95%). This allows for proactive response by deleting old logs, caches, or scaling disk space.
2.8. Network Services Status and Ports
Checking the availability of key network services (HTTP, HTTPS, SSH, PostgreSQL, Redis, etc.) using Blackbox Exporter ensures that not only the VPS is running, but also the applications on it are responding. This is an external view of your service, simulating a user or another service's request. It is important to track not only availability (up/down) but also the response time (latency) of these services.
Each of these criteria is important, and their comprehensive analysis allows for a complete picture of the health of your VPS and the applications running on it. Using Prometheus and its exporters makes collecting these metrics a relatively simple and unified process.
3. Comparison Table of Monitoring Solutions
Choosing a monitoring system is a strategic decision that depends on many factors: team size, budget, infrastructure complexity, scalability requirements, and flexibility. In 2026, the market offers a variety of solutions, from fully managed SaaS platforms to powerful open-source tools. Let's examine how Prometheus, Grafana, and Alertmanager (PGA stack) compare to popular alternatives such as Zabbix and Datadog.
| Criterion | Prometheus + Grafana + Alertmanager (PGA Stack) | Zabbix | Datadog (SaaS) | Netdata (lightweight) |
|---|---|---|---|---|
| Solution Type | Self-hosted, Open Source | Self-hosted, Open Source | SaaS (cloud-based) | Self-hosted, Open Source |
| Metric Collection Model | Pull-model (Prometheus scrapes exporters) | Agent-based (Zabbix agent sends data) | Agent-based (Datadog agent sends data) | Agent-based (local agent collects and serves metrics via HTTP) |
| Configuration Flexibility | High. Wide choice of exporters, powerful PromQL, flexible alert configuration in Alertmanager. | Medium. Many templates, but custom metrics require more complex configuration. | High. Many out-of-the-box integrations, user-friendly UI for configuration. | Medium. Many built-in collectors, but custom metrics require writing plugins. |
| Scalability | Good. Horizontal scaling via federated Prometheus, Thanos/Cortex for long-term storage. | Good. Distributed architecture, proxies. | Excellent. Cloud platform, virtually unlimited scalability. | Limited. Designed for single-host monitoring, not clusters. |
| Deployment Complexity | Medium. Requires understanding of components, Docker Compose or Kubernetes simplifies. | Medium. Requires server, database, agent configuration. | Low. Agent installation and UI configuration. | Very low. Single-command installation. |
| Cost (2026, example) | Low (VPS cost for hosting, from $10-30/month for a small server + engineering time). | Low (VPS cost for hosting, from $10-30/month for a small server + engineering time). | High (from $15-20/host/month + metrics, logs, APM. For 10 VPS it can be $300-500+/month). | Low (VPS cost for hosting, minimal resource requirements). |
| Long-term Storage | Limited by default (local storage). Requires integration with Thanos/Cortex/VictoriaMetrics for scaling and long-term storage. | Built-in. Depends on database size. | Built-in, cloud-based, configurable. | Local, very short period (hours/days) in RAM, optionally to disk. |
| Visualization | Excellent (Grafana). Powerful dashboards, many graph types, custom queries. | Good. Built-in graphs, network maps, but less flexible than Grafana. | Excellent. Rich UI, many widgets, user-friendly dashboards. | Good. Built-in web interface with many real-time graphs. |
| Alerting | Excellent (Alertmanager). Flexible rules, grouping, inhibition, many channels. | Good. Flexible triggers, actions, but less advanced group management than Alertmanager. | Excellent. Intelligent alerts, machine learning, many channels. | Basic. Email, Slack, but without advanced grouping logic. |
| Community and Support | Active Open Source community, rich documentation, many ready-made solutions. | Active Open Source community, commercial support. | Commercial support, extensive documentation. | Active Open Source community. |
| Applicability | From small VPS to large Kubernetes clusters. Ideal for DevOps-oriented teams. | From small VPS to large enterprise infrastructures. Traditional choice for system administrators. | From startups to large enterprises. Excellent for teams valuing deployment speed and manageability. | Fast local monitoring of a single server. Excellent for on-site diagnostics. |
As seen from the table, the PGA stack offers a powerful, flexible, and cost-effective solution, especially for teams willing to invest time in configuration and maintenance. Its Open Source nature provides full control over data and infrastructure, which is critical for many SaaS founders and CTOs. Datadog wins in deployment speed and manageability, but its cost quickly increases with scale. Zabbix is a time-tested solution, but its approach to metrics and visualization may seem less modern compared to Prometheus/Grafana. Netdata is an excellent tool for quick local analysis but is not designed for centralized cluster monitoring.
In the context of VPS monitoring, where deep control and resource optimization are often required, the PGA stack strikes an ideal balance between functionality, cost, and flexibility. It allows you to start small and scale as your project grows, while maintaining full transparency and control over your monitoring system.
4. Detailed Overview of Components: Prometheus, Grafana, Alertmanager, and Exporters
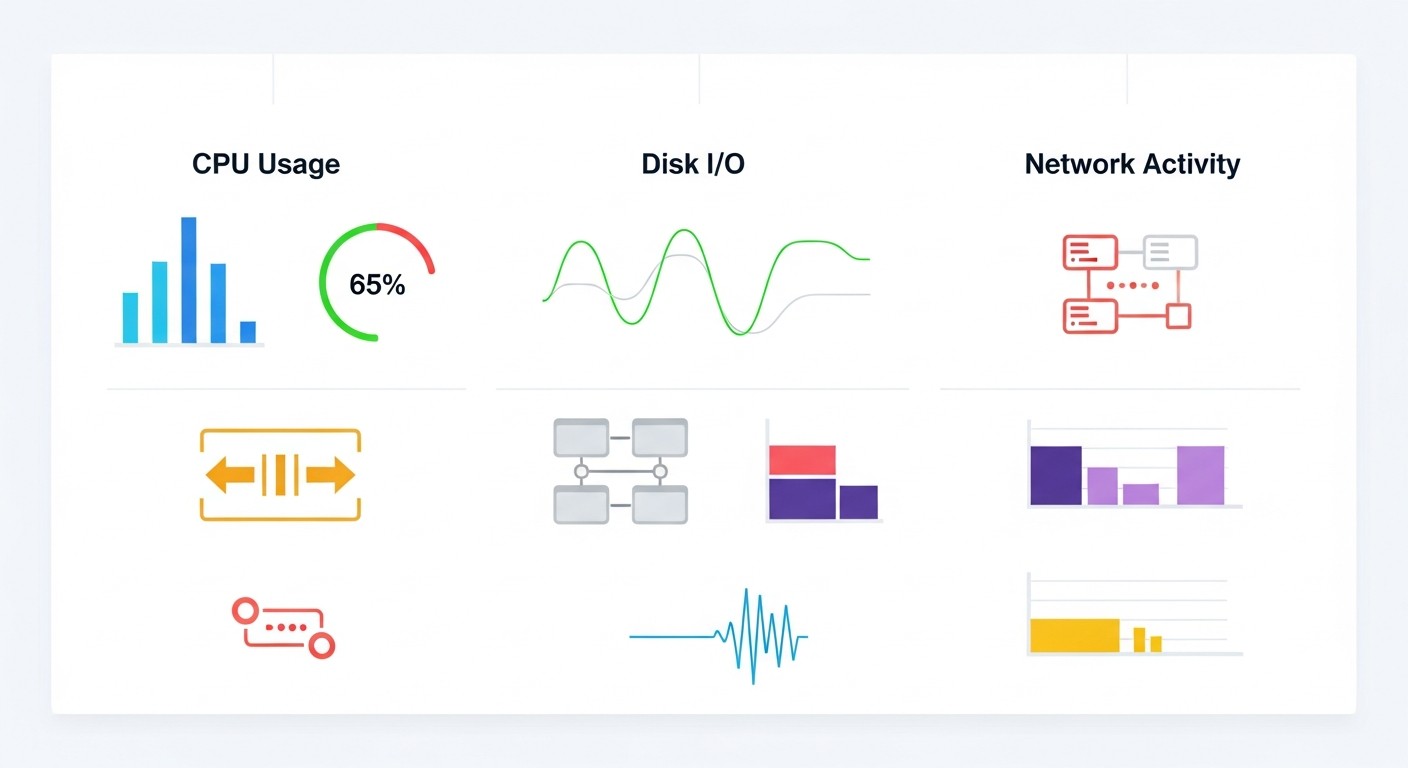
To create a full-fledged VPS monitoring system, we will need not only the main trio but also a number of auxiliary components called "exporters." Each of them performs its unique role, collecting and providing metrics in a format understandable to Prometheus.
4.1. Prometheus: The Heart of the Metric Collection System
Prometheus is a powerful monitoring and alerting system developed at SoundCloud and has become the de facto standard for monitoring containerized and cloud environments. Its key feature is the pull model: Prometheus itself scrapes target objects (exporters) via HTTP, retrieving metrics from them. This simplifies the discovery and management of new targets.
Architecture and Operating Principle: Prometheus consists of several components: the main Prometheus server (collects, stores, and queries metrics), Pushgateway (for ephemeral/batch-jobs), Service Discovery (for automatic target discovery), and Alertmanager (for alert processing). Metrics are stored in a time series format with labels, which makes them incredibly flexible for querying and aggregation.
PromQL: Prometheus Query Language (PromQL) is its most powerful advantage. It allows not only selecting metrics but also performing complex aggregations, mathematical operations, filtering by labels, calculating rates of change (rate), forecasting (predict_linear), and much more. For example, the query sum(rate(node_cpu_seconds_total{mode="idle"}[5m])) by (instance) will show the average CPU utilization over the last 5 minutes for each VPS instance. A deep understanding of PromQL is critically important for creating effective dashboards and alerting rules.
Pros: Excellent scalability (via federated, Thanos, Cortex), flexible query language, active community, a huge number of ready-made exporters, low overhead for metric collection. Ideal for dynamic environments.
Cons: Local metric storage by default (requires additional solutions for long-term storage), lack of a built-in UI for comprehensive visualization (Grafana is needed for this), the pull model may not be optimal for some scenarios (but Pushgateway solves this problem).
Who it's for: For DevOps engineers and system administrators who need full control over monitoring, as well as for backend developers who want to integrate their application metrics. Excellent for microservices and cloud infrastructures.
4.2. Grafana: Data Visualization and Dashboard Creation
Grafana is an open-source platform for analytics and interactive data visualization. It allows you to create beautiful and informative dashboards using data from various sources, including Prometheus. Grafana does not collect metrics itself, but only queries them from configured data sources and displays them in a user-friendly way.
Capabilities: Support for multiple data sources (Prometheus, InfluxDB, PostgreSQL, Elasticsearch, Zabbix, etc.), a wide range of panels (graphs, tables, histograms, text, status indicators), templating variables for dynamic dashboard changes, the ability to configure alerts (although for the Prometheus stack, it's better to use Alertmanager). In 2026, Grafana continues to actively develop, offering new visualization types, improved performance, and collaboration features.
Pros: Exceptional visualization flexibility, PromQL support, large community, many ready-made dashboards (Grafana Labs Dashboard Library), ability to share and manage access rights.
Cons: Not a metric collection system itself, requires separate data source configuration. Can be overkill for very simple tasks where a command line is sufficient.
Who it's for: For anyone who wants to visually see the state of their infrastructure and applications. From CTOs who need high-level metrics to developers who care about performance details. SaaS founders can use Grafana to track key business metrics.
4.3. Alertmanager: Smart Alert Management
Alertmanager is a component of the Prometheus stack that processes alerts sent by the Prometheus server. Its main task is to deduplicate, group, route, and inhibit alerts so that your team receives only meaningful notifications, not a flood of similar messages.
Key Features:
- Grouping: Combines similar alerts into a single notification to avoid spam. For example, if 10 VPS simultaneously exceed a CPU threshold, Alertmanager will send one message about the cluster problem, not 10 separate ones.
- Inhibition: Allows suppressing alerts if a more "severe" alert is already active. For example, if the entire server is down, there's no point in receiving alerts about high CPU utilization on that server.
- Silences: Temporarily disables alerts for specific targets or label sets, useful during planned maintenance or to ignore known temporary issues.
- Routing: Sends alerts to different channels based on their labels. For example, critical alerts to PagerDuty, warnings to a DevOps Slack channel, and informational alerts to email.
Pros: Exceptional flexibility in configuring alerting rules, prevention of "alert fatigue," support for many integrations (Slack, Telegram, email, PagerDuty, VictorOps, etc.), ability to create complex alert chains.
Cons: Requires careful rule configuration for optimal operation, can be complex for beginners.
Who it's for: For anyone who doesn't want to be overwhelmed with unnecessary alerts. Especially critical for teams supporting large and complex systems where timely and relevant alerting directly impacts service recovery time (MTTR).
4.4. Exporters: Bridges to Metrics
Exporters are small applications that collect metrics from various sources (operating system, databases, web servers, applications) and expose them in Prometheus format (via HTTP on the /metrics port). Without exporters, Prometheus would not be able to collect data.
- Node Exporter: The most important exporter for VPS monitoring. It collects Linux operating system metrics: CPU, RAM, disk I/O, network activity, Load Average, file systems, process statistics, and much more. It is installed on each monitored VPS.
- cAdvisor: For monitoring Docker containers. Collects resource usage metrics (CPU, RAM, network, disk) for each container running on the host.
- Blackbox Exporter: For external service availability monitoring. It can check HTTP/HTTPS endpoints, TCP ports, perform ICMP pings, and DNS queries. Allows monitoring the availability of your VPS and applications on it from an external perspective.
- Pushgateway: Not strictly an exporter, but an important component for collecting metrics from short-lived (ephemeral) or batch jobs that cannot be scraped by Prometheus. Jobs send their metrics to Pushgateway, and Prometheus then scrapes Pushgateway.
- Specialized Exporters: There is a huge number of exporters for specific applications and services:
Nginx exporter,MySQL exporter,PostgreSQL exporter,Redis exporter,MongoDB exporter,RabbitMQ exporter, and many others. They allow for deep insights into the operation of your applications.
The choice and correct configuration of exporters determine the completeness and detail of the collected metrics, which directly impacts the effectiveness of the entire monitoring system.
5. Practical Tips and Step-by-Step Deployment Instructions
Deploying the Prometheus, Grafana, and Alertmanager stack on a VPS might seem complex, but with the right approach and using Docker Compose, this process is significantly simplified. We will cover the installation of all components on a single VPS, which is a typical scenario for small to medium-sized projects.
5.1. VPS Preparation
Before starting the installation, ensure your VPS meets the minimum requirements: 2 CPU cores, 4 GB RAM, and 50-100 GB SSD for Prometheus (depending on the volume of stored metrics). Install Docker and Docker Compose.
# Обновляем систему
sudo apt update && sudo apt upgrade -y

# Устанавливаем Docker
sudo apt install -y apt-transport-https ca-certificates curl software-properties-common
curl -fsSL https://download.docker.com/linux/ubuntu/gpg | sudo gpg --dearmor -o /usr/share/keyrings/docker-archive-keyring.gpg
echo "deb [arch=$(dpkg --print-architecture) signed-by=/usr/share/keyrings/docker-archive-keyring.gpg] https://download.docker.com/linux/ubuntu $(lsb_release -cs) stable" | sudo tee /etc/apt/sources.list.d/docker.list > /dev/null
sudo apt update
sudo apt install -y docker-ce docker-ce-cli containerd.io

# Добавляем текущего пользователя в группу docker для работы без sudo
sudo usermod -aG docker $USER
# Выйдите и войдите заново или выполните: newgrp docker

# Устанавливаем Docker Compose (актуальная версия на 2026 год, проверьте на сайте Docker)
# Замените 'v2.x.x' на актуальную версию
sudo mkdir -p ~/.docker/cli-plugins/
curl -SL https://github.com/docker/compose/releases/download/v2.24.5/docker-compose-linux-x86_64 -o ~/.docker/cli-plugins/docker-compose
sudo chmod +x ~/.docker/cli-plugins/docker-compose
# Или для более старых версий (v1.x):
# sudo curl -L "https://github.com/docker/compose/releases/download/1.29.2/docker-compose-$(uname -s)-$(uname -m)" -o /usr/local/bin/docker-compose
# sudo chmod +x /usr/local/bin/docker-compose

# Проверяем установки
docker --version
docker compose version
5.2. Project Structure and Configuration Files
Let's create a directory for the project and necessary subdirectories:
mkdir -p monitoring/{prometheus,grafana,alertmanager}
cd monitoring
5.2.1. Prometheus Configuration (prometheus/prometheus.yml)
This file defines which targets Prometheus should scrape, how long to store data, and which alerting rules to use.
# prometheus/prometheus.yml
global:
  scrape_interval:     15s # How often Prometheus will scrape targets
  evaluation_interval: 15s # How often Prometheus will check alerting rules

# Alertmanager configuration
alerting:
  alertmanagers:
  - static_configs:
    - targets:
      - alertmanager:9093 # Service name and port of Alertmanager in Docker Compose

# Alerting rules
rule_files:
  - "/etc/prometheus/alert.rules.yml" # Path to the file with alerting rules

# Targets for metric collection
scrape_configs:
  # Monitoring Prometheus itself
  - job_name: 'prometheus'
    static_configs:
      - targets: ['localhost:9090']

  # Monitoring Node Exporter (on this same VPS)
  - job_name: 'node_exporter'
    static_configs:
      - targets: ['localhost:9100'] # Node Exporter port

  # Monitoring other VPS (example)
  # - job_name: 'remote_vps_node_exporter'
  #   static_configs:
  #     - targets: ['your_remote_vps_ip:9100'] # Replace with the IP of the remote VPS
  #       labels:
  #         environment: production
  #         datacenter: fra1
5.2.2. Prometheus Alerting Rules (prometheus/alert.rules.yml)
Here, the conditions under which Prometheus should generate an alert and send it to Alertmanager are defined.
# prometheus/alert.rules.yml
groups:
- name: node_alerts
  rules:
  - alert: HighCPUUsage
    expr: 100 - (avg by (instance) (rate(node_cpu_seconds_total{mode="idle"}[5m])) * 100) > 85
    for: 5m
    labels:
      severity: warning
    annotations:
      summary: "High CPU usage on {{ $labels.instance }}"
      description: "CPU usage on {{ $labels.instance }} exceeds 85% for more than 5 minutes. Current value: {{ $value | humanize }}%."

  - alert: LowDiskSpace
    expr: node_filesystem_avail_bytes{fstype="ext4",mountpoint="/"} / node_filesystem_size_bytes{fstype="ext4",mountpoint="/"} * 100 < 10
    for: 2m
    labels:
      severity: critical
    annotations:
      summary: "Low disk space on {{ $labels.instance }}"
      description: "Less than 10% free disk space on {{ $labels.mountpoint }} on {{ $labels.instance }}. Current value: {{ $value | humanize }}%."

  - alert: HighMemoryUsage
    expr: (node_memory_MemTotal_bytes - (node_memory_MemFree_bytes + node_memory_Buffers_bytes + node_memory_Cached_bytes)) / node_memory_MemTotal_bytes * 100 > 90
    for: 5m
    labels:
      severity: warning
    annotations:
      summary: "High memory consumption on {{ $labels.instance }}"
      description: "RAM usage on {{ $labels.instance }} exceeds 90% for more than 5 minutes. Current value: {{ $value | humanize }}%."

  - alert: ServerDown
    expr: up == 0
    for: 1m
    labels:
      severity: critical
    annotations:
      summary: "Server {{ $labels.instance }} is unreachable"
      description: "Target {{ $labels.instance }} is unreachable for Prometheus for more than 1 minute."
5.2.3. Alertmanager Configuration (alertmanager/alertmanager.yml)
This file defines where and how Alertmanager should send alerts.
# alertmanager/alertmanager.yml
global:
  resolve_timeout: 5m # Time during which an alert is considered "active" after disappearing

route:
  group_by: ['alertname', 'instance'] # Group alerts by alert name and instance
  group_wait: 30s # Wait 30 seconds before sending the first alert from a group
  group_interval: 5m # Interval between repeat alerts for the same group
  repeat_interval: 4h # Repeat interval for alerts if the problem is not resolved

  # Default receiver for all alerts
  receiver: 'default-receiver'

  routes:
  # Example routing for critical alerts to PagerDuty
  - match:
      severity: 'critical'
    receiver: 'pagerduty-receiver'
    continue: true # Continue processing with other routes

  # Example routing for warning alerts to Slack
  - match:
      severity: 'warning'
    receiver: 'slack-receiver'

receivers:
  - name: 'default-receiver'
    # Fallback if no other route matched. Can be configured for email.
    email_configs:
      - to: 'your_email@example.com' # Replace with your email
        from: 'alertmanager@yourdomain.com'
        smarthost: 'smtp.yourdomain.com:587' # Example SMTP server
        auth_username: 'your_smtp_username'
        auth_password: 'your_smtp_password'
        require_tls: true

  - name: 'slack-receiver'
    slack_configs:
      - channel: '#devops-alerts' # Replace with your Slack channel
        api_url: 'https://hooks.slack.com/services/T00000000/B00000000/XXXXXXXXXXXXXXXXXXXXXXXX' # Replace with your Webhook URL
        send_resolved: true
        title: '{{ .CommonLabels.alertname }} on {{ .CommonLabels.instance }} ({{ .Status | toUpper }})'
        text: '{{ range .Alerts }}*Summary:* {{ .Annotations.summary }}\n*Description:* {{ .Annotations.description }}\n*Severity:* {{ .Labels.severity }}\n*Starts At:* {{ .StartsAt.Format "2006-01-02 15:04:05 MST" }}\n{{ end }}'

  - name: 'pagerduty-receiver'
    pagerduty_configs:
      - service_key: 'YOUR_PAGERDUTY_SERVICE_INTEGRATION_KEY' # Replace with your PagerDuty key
        severity: '{{ .CommonLabels.severity }}'
        description: '{{ .CommonLabels.alertname }} on {{ .CommonLabels.instance }} ({{ .Status | toUpper }})'
5.2.4. Grafana Configuration
For Grafana, you can use the standard grafana/grafana.ini file, but often default settings or environment variables in Docker Compose are sufficient. The main settings that might be needed are the administrative login/password and the Prometheus data source.
To save Grafana data (dashboards, users), let's create an empty directory grafana/data.
5.3. Docker Compose File (docker-compose.yml)
Let's combine all components into a single docker-compose.yml file in the root monitoring directory:
# docker-compose.yml
version: '3.8'

volumes:
  prometheus_data: {}
  grafana_data: {}
  alertmanager_data: {}

services:
  prometheus:
    image: prom/prometheus:v2.49.1 # Current version for 2026
    container_name: prometheus
    ports:
      - "9090:9090"
    volumes:
      - ./prometheus/prometheus.yml:/etc/prometheus/prometheus.yml
      - ./prometheus/alert.rules.yml:/etc/prometheus/alert.rules.yml
      - prometheus_data:/prometheus
    command:
      - '--config.file=/etc/prometheus/prometheus.yml'
      - '--storage.tsdb.path=/prometheus'
      - '--web.console.libraries=/usr/share/prometheus/console_libraries'
      - '--web.console.templates=/usr/share/prometheus/consoles'
      - '--storage.tsdb.retention.time=30d' # Store data for 30 days
    restart: unless-stopped
    depends_on:
      - alertmanager

  grafana:
    image: grafana/grafana:10.3.3 # Current version for 2026
    container_name: grafana
    ports:
      - "3000:3000"
    volumes:
      - grafana_data:/var/lib/grafana
    environment:
      - GF_SECURITY_ADMIN_USER=admin
      - GF_SECURITY_ADMIN_PASSWORD=your_strong_password # MUST CHANGE!
      - GF_SERVER_ROOT_URL=http://localhost:3000 # Or your domain/IP
    restart: unless-stopped
    depends_on:
      - prometheus

  alertmanager:
    image: prom/alertmanager:v0.27.0 # Current version for 2026
    container_name: alertmanager
    ports:
      - "9093:9093"
      - "9094:9094" # For UDP
    volumes:
      - ./alertmanager/alertmanager.yml:/etc/alertmanager/alertmanager.yml
      - alertmanager_data:/alertmanager
    command:
      - '--config.file=/etc/alertmanager/alertmanager.yml'
      - '--storage.path=/alertmanager'
    restart: unless-stopped

  node_exporter:
    image: prom/node-exporter:v1.7.0 # Current version for 2026
    container_name: node_exporter
    ports:
      - "9100:9100"
    command:
      - '--path.rootfs=/host'
    volumes:
      - /:/host:ro,rslave # Mount host root FS
    network_mode: host # Use host network stack to access metrics
    restart: unless-stopped
5.4. Launching the Monitoring System
After creating all the files, run Docker Compose in the monitoring directory:
docker compose up -d
Check the container status:
docker compose ps
5.5. Grafana Configuration
1. Open Grafana in your browser: http://your_vps_ip:3000. Log in with username admin and password your_strong_password.
2. Add Prometheus as a data source:
- Go to Configuration (gear icon on the left) -> Data Sources.
- Click "Add data source" -> "Prometheus".
- In the "URL" field, enter
http://prometheus:9090(since Prometheus and Grafana are in the same Docker network, they can see each other by service names). - Click "Save & Test". You should see a "Data Source is working" message.
3. Import a pre-built dashboard for Node Exporter:
- Go to Dashboards (square with graphs icon) -> Import.
- In the "Import via grafana.com" field, enter ID:
1860(or another current ID for Node Exporter Full). - Select Prometheus as the data source and click "Import".
Now you should have a fully functional dashboard displaying your VPS metrics.
5.6. Advanced Monitoring: Blackbox Exporter
To monitor the availability of external services or the VPS itself from the outside, add Blackbox Exporter to docker-compose.yml:
  blackbox_exporter:
    image: prom/blackbox-exporter:v0.25.0 # Current version for 2026
    container_name: blackbox_exporter
    ports:
      - "9115:9115"
    volumes:
      - ./blackbox/blackbox.yml:/etc/blackbox_exporter/config.yml
    command:
      - '--config.file=/etc/blackbox_exporter/config.yml'
    restart: unless-stopped
Create the file blackbox/blackbox.yml:
# blackbox/blackbox.yml
modules:
  http_2xx:
    prober: http
    http:
      preferred_ip_protocol: "ipv4"
      no_follow_redirects: false
      tls_config:
        insecure_skip_verify: true # In production, it's better to use valid certificates
  icmp:
    prober: icmp
    icmp:
      preferred_ip_protocol: "ipv4"
And add a new target for Blackbox Exporter to prometheus/prometheus.yml. For example, to check the availability of your website:
  - job_name: 'blackbox_http'
    metrics_path: /probe
    params:
      module: [http_2xx]
    static_configs:
      - targets:
        - 'https://your_website.com' # Replace with your website URL
        - 'http://your_vps_ip:80' # Or your VPS IP
    relabel_configs:
      - source_labels: [__address__]
        target_label: __param_target
      - source_labels: [__param_target]
        target_label: instance
      - target_label: __address__
        replacement: blackbox_exporter:9115 # Blackbox Exporter address
After changing docker-compose.yml and prometheus.yml, restart the services:
docker compose up -d --no-deps prometheus blackbox_exporter
docker compose restart prometheus
Now Prometheus will scrape Blackbox Exporter, which in turn will check the availability of your website or other services. You can add an alert, for example, alert: WebsiteDown, if probe_success == 0.
These steps lay the foundation for a powerful and flexible monitoring system. Remember that this is just a starting point. Further configuration will involve creating custom dashboards, more complex alerting rules, and integrating with your application metrics.
6. Common Mistakes in Monitoring Setup and Operation
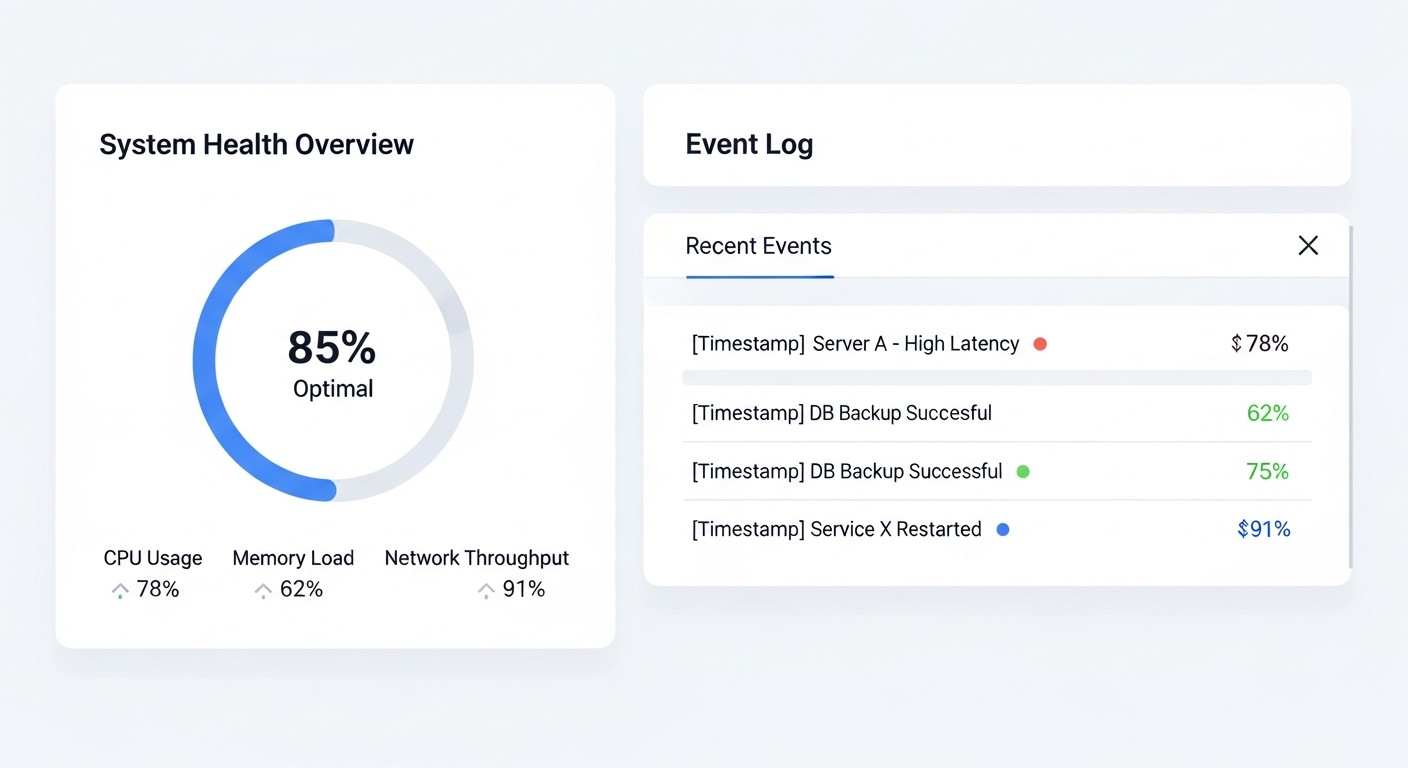
Even with powerful tools like Prometheus, Grafana, and Alertmanager, errors in their configuration and operation can negate all benefits. By knowing the most common pitfalls, you can significantly increase the effectiveness of your monitoring system.
6.1. Lack of Monitoring for the Monitoring System Itself (Self-monitoring)
Paradoxically, one of the most common and critical mistakes is not monitoring the Prometheus stack itself. If the Prometheus server goes down, you won't know about the state of your VPS or the failure of Prometheus itself. It's important to set up monitoring for the availability of Prometheus, Grafana, and Alertmanager. Prometheus by default collects metrics about itself (job_name: 'prometheus'). For Alertmanager and Grafana, you can also use Blackbox Exporter to check their HTTP endpoints, and for Alertmanager, its own metrics.
How to avoid: Include targets for Prometheus itself, Alertmanager, and Blackbox Exporter in prometheus.yml. Set up basic alerts for up == 0 for these components. Consider deploying a minimal "watchdog" Prometheus on a separate VPS or using an external ping monitoring service to alert if the main Prometheus is unavailable.
6.2. "Alert Fatigue" — Alert Overload
If your team receives hundreds of alerts a day, most of which do not require immediate attention or are false positives, this leads to "alert fatigue." Engineers start ignoring alerts, which can lead to missing truly critical problems. This is one of the main reasons why Alertmanager is so important.
How to avoid:
- Carefully configure thresholds: Start with high thresholds and gradually lower them based on the actual performance of your systems.
- Use
forin Prometheus: Specifyfor: 5m(or another duration) so that an alert only fires after the condition has persisted for the specified period. This filters out short-term spikes. - Use grouping and inhibition in Alertmanager: Combine similar alerts, inhibit less important ones if more critical ones exist.
- Separate severity: Define levels (
info,warning,critical) and route them to different channels. "Info" can go to a Slack channel, "warning" to Telegram, "critical" to PagerDuty. - Regularly review rules: Remove alerts that constantly fire without a real problem.
6.3. Incorrect Use of PromQL and Inefficient Queries
PromQL is a powerful but complex language. Incorrect queries can lead to inaccurate metrics, high load on Prometheus, or even its crash. For example, using sum() without by() can aggregate too much data, and rate() over too short an interval can be too "noisy."
How to avoid:
- Learn PromQL: Spend time understanding the functions
rate(),irate(),increase(), aggregation operators (sum,avg,max,min), and matching operators (on,group_left,group_right). - Test queries: Use the Prometheus UI to test queries before adding them to Grafana or alerting rules.
- Be careful with labels: High cardinality (too many unique label combinations) can lead to performance and storage issues. Avoid using labels with unique values, such as session IDs or client IP addresses.
6.4. Lack of Long-Term Metric Storage
By default, Prometheus stores metrics locally for a limited time (usually 15-30 days). This may not be enough for analyzing long-term trends, retrospective incident analysis, or auditing. Attempting to store data locally on a single VPS for a year or more can lead to insufficient disk space and performance degradation.
How to avoid:
- Use remote storage: Integrate Prometheus with long-term storage solutions such as Thanos, Cortex, or VictoriaMetrics. These systems allow storing metrics in S3-compatible storage (e.g., MinIO, AWS S3, Yandex Object Storage), scaling queries, and ensuring high availability.
- Manage retention policies: Define which metrics and for how long they should be stored. Perhaps 30 days is enough for some metrics, while a year is needed for others.
6.5. Insufficient Documentation and Lack of Runbooks
Even the most perfect monitoring system is useless if the team doesn't know how to use it or what to do when alerts fire. Lack of documentation for dashboards, alerts, and response procedures (runbooks) leads to panic and long recovery times.
How to avoid:
- Document dashboards: Add descriptions to panels and dashboards in Grafana, explaining what the metrics show and what different values mean.
- Create Runbooks: For each important alert, create a "Runbook" — a step-by-step guide on what to check, what commands to execute, and whom to contact when the alert fires. This can be integrated directly into the alert description in Prometheus.
- Provide training: Regularly train new team members on how to work with the monitoring system.
6.6. Ignoring Security
Exposing Prometheus, Grafana, and Alertmanager ports to the internet without proper protection is a serious vulnerability. Through Grafana, you can gain access to your metrics, and through Prometheus, to data about your infrastructure. An unprotected Alertmanager can be used for spamming or spoofing alerts.
How to avoid:
- Use a firewall: Restrict access to ports 9090 (Prometheus), 3000 (Grafana), 9093 (Alertmanager) only to trusted IP addresses or your internal network.
- Set up a reverse proxy: Use Nginx or Caddy with HTTPS and basic authentication (Basic Auth) or OAuth for access to Grafana and Alertmanager.
- Use strong passwords: For Grafana, use a complex administrative password and change it regularly.
- Enable TLS: Configure TLS for all components if they are accessible externally.
By avoiding these common mistakes, you can build a truly reliable, useful, and manageable monitoring system that will help your team maintain the stability and performance of your VPS and applications in 2026 and beyond.
7. Checklist for Practical Application of a Monitoring System
This checklist will help you ensure that your Prometheus, Grafana, and Alertmanager-based monitoring system is configured correctly and operating effectively. Review it regularly, especially after major infrastructure changes or the deployment of new services.
- VPS Preparation:
- [ ] Sufficient CPU, RAM, and SSD allocated for all monitoring components.
- [ ] Docker and Docker Compose installed (current versions for 2026).
- [ ] Necessary ports opened in the firewall (9090 for Prometheus, 3000 for Grafana, 9093 for Alertmanager) or a reverse proxy configured.
- Basic Component Installation (Docker Compose):
- [ ] Directories created for configurations and data (
prometheus,grafana,alertmanager). - [ ]
docker-compose.ymlfile configured with current images for Prometheus, Grafana, Alertmanager, Node Exporter. - [ ] Docker volumes configured for persistent data storage (
prometheus_data,grafana_data,alertmanager_data). - [ ] A strong password set for the Grafana administrator.
- [ ] Directories created for configurations and data (
- Prometheus Configuration (
prometheus.yml):- [ ]
scrape_intervalandevaluation_intervaloptimally configured (15-30 seconds). - [ ]
alertingconfigured and Alertmanager address specified. - [ ] Path to
rule_filesspecified. - [ ]
job_name: 'prometheus'added for self-monitoring. - [ ]
job_name: 'node_exporter'added for local VPS monitoring. - [ ] A reasonable
--storage.tsdb.retention.timeset (e.g., 30-90 days).
- [ ]
- Prometheus Alerting Rules (
alert.rules.yml):- [ ] Basic alerts created for CPU (
HighCPUUsage), RAM (HighMemoryUsage), disk (LowDiskSpace). - [ ] Alert configured for server unavailability (
ServerDown). - [ ]
forspecified for each alert (e.g.,5m) to prevent false positives. - [ ]
severity(critical, warning, info) added for each alert. - [ ] Informative
summaryanddescriptioncreated for each alert.
- [ ] Basic alerts created for CPU (
- Alertmanager Configuration (
alertmanager.yml):- [ ]
routeconfigured withgroup_by,group_wait,group_interval,repeat_interval. - [ ]
receiverdefined for all necessary channels (Slack, Telegram, Email, PagerDuty). - [ ] Specific
routesconfigured for differentseveritylevels. - [ ] All integrations with messengers/alerting services checked and tested.
- [ ]
- Grafana Setup:
- [ ] Prometheus added as a data source with URL
http://prometheus:9090. - [ ] Pre-built dashboard for Node Exporter imported (e.g., ID 1860).
- [ ] Dashboards created or imported for application monitoring and other exporters.
- [ ] Access rights configured for Grafana users.
- [ ] Prometheus added as a data source with URL
- Additional Exporters:
- [ ]
Node Exporterinstalled and configured on each monitored VPS. - [ ]
Blackbox Exporterinstalled and configured for external service availability monitoring. - [ ] Specialized exporters for your applications (Nginx, MySQL, Redis, etc.) installed and configured.
- [ ] All new exporters added to
prometheus.yml.
- [ ]
- Testing and Validation:
- [ ] Availability of all web interfaces checked (Prometheus:9090, Grafana:3000, Alertmanager:9093).
- [ ] In Prometheus UI (Status -> Targets), all targets marked as
UP. - [ ] In Prometheus UI (Alerts), active alerts checked.
- [ ] Sending of test alerts via Alertmanager verified.
- [ ] Correct display of metrics on Grafana dashboards verified.
- [ ] Test situations initiated (e.g., artificially loaded CPU) to check alert triggering.
- Security:
- [ ] Monitoring ports closed to the outside world or protected by a reverse proxy with authentication.
- [ ] Strong passwords used for Grafana and any other authentication credentials.
- [ ] HTTPS configured for Grafana and Alertmanager access if they are exposed to the internet.
- Optimization and Scaling:
- [ ] Solutions for long-term metric storage considered (Thanos, Cortex, VictoriaMetrics).
- [ ] Metric cardinality analyzed to prevent Prometheus performance issues.
- [ ] Alerting rules regularly reviewed and optimized.
By following this checklist, you will significantly increase the reliability and effectiveness of your monitoring system, allowing you to quickly respond to incidents and make informed decisions for the development of your projects.
8. Cost Calculation and Economics of Owning a Monitoring System
When choosing and deploying a monitoring system, especially for startups and SaaS projects, the economic aspect plays no less a role than technical capabilities. Although Prometheus, Grafana, and Alertmanager are Open Source, their deployment and support are not free. Let's look at the main cost items and ways to optimize them by 2026.
8.1. Main Cost Items
8.1.1. Cost of VPS for the Monitoring System
This is perhaps the most obvious cost item. Hosting Prometheus, Grafana, and Alertmanager requires a separate VPS. Its requirements depend on the volume of metrics collected (number of targets, collection frequency, storage duration).
- Small project (1-5 VPS, 1000-5000 metrics): 2 CPU, 4 GB RAM, 50-100 GB SSD. Cost from providers like Hetzner, DigitalOcean, Vultr can range from $10 to $30 per month in 2026.
- Medium project (10-30 VPS, 10,000-50,000 metrics): 4 CPU, 8-16 GB RAM, 200-500 GB SSD. Cost: $40 to $100 per month.
- Large project (50+ VPS, 100,000+ metrics): Requires a distributed architecture (Thanos/Cortex/VictoriaMetrics), which increases complexity and cost, but allows saving on the central Prometheus server. Cost can be $150+ per month just for monitoring infrastructure, not including S3 storage.
8.1.2. Cost of Metric Storage (S3-compatible storage)
If you plan for long-term metric storage (more than 30-90 days), you will need remote storage, usually S3-compatible. This can be AWS S3, Google Cloud Storage, Yandex Object Storage, or your own MinIO cluster.
- AWS S3 (Standard Storage): ~$0.023 per GB per month.
- Yandex Object Storage: ~$0.019 per GB per month.
- MinIO (self-hosted): Cost of disks and VPS for MinIO.
For a project generating 100,000 metrics per second (which is a lot), storage volume can reach 100-200 GB per day, totaling 36-72 TB per year. This is very expensive. Therefore, it is important to aggregate metrics for long-term storage or store only the most important ones.
8.1.3. Engineering Time (the biggest hidden cost)
This is the most significant and often underestimated cost item. Implementing, configuring, maintaining, updating, and debugging a monitoring system requires skilled engineering time.
- Initial setup: From 1-2 days for a basic stack on a single VPS to several weeks for a complex distributed system.
- Support and optimization: From a few hours per week for a small project to a full-time DevOps engineer for a large one.
- Development of custom exporters and dashboards: Depends on the complexity of your applications.
The average rate for a DevOps engineer in 2026 is $60-100+ per hour. Even 10 hours a month for support is $600-1000. This is significantly more than the cost of a VPS.
8.1.4. Alerting Costs (SMS, PagerDuty)
If you use paid alerting channels, such as SMS gateways or services like PagerDuty, VictorOps, this also adds to the costs.
- PagerDuty: From $10-20 per user per month.
- SMS gateways: From $0.01 to $0.05 per SMS, depending on the region and provider.
For small teams, free channels such as Slack, Telegram, email are usually sufficient.
8.2. Comparative Cost Table (approximate for 2026)
Approximate calculations for a SaaS project with 10 VPS, 20,000 metrics, 1 year of data retention, 2 DevOps engineers.
| Cost Item | Prometheus + Grafana + Alertmanager (Self-hosted) | Datadog (SaaS) |
|---|---|---|
| VPS for monitoring (1 unit) | $50/month * 12 = $600/year | Included in SaaS cost |
| Metric storage (Thanos/S3, 1TB/year) | $20/month * 12 = $240/year | Included in SaaS cost (depends on volume) |
| Agent cost for 10 VPS | Free (Node Exporter) | $15/host/month * 10 hosts * 12 = $1800/year |
| APM/Logs/Profiling (analog) | Free (OpenTelemetry, Loki, Pyroscope) + additional VPS | $30/host/month * 10 hosts * 12 = $3600/year |
| Engineering time (setup/support, 20 h/month) | $80/hour * 20 h/month * 12 = $19200/year | $80/hour * 10 h/month * 12 = $9600/year (less due to manageability) |
| Alerts (PagerDuty) | $20/month * 2 engineers * 12 = $480/year | $20/month * 2 engineers * 12 = $480/year |
| TOTAL (approximate) | ~$20720/year | ~$15480/year |
Note: These figures are very approximate and can vary greatly. For Datadog, the price can be significantly higher when using all features (APM, Security, Synthetics). For self-hosted solutions, engineering time is the dominant cost.
8.3. How to Optimize Costs
Although engineering time is the largest cost item, investing in it pays off in the long run through a deep understanding of the system and the ability to customize.
- Choose optimal hosting: For a VPS for monitoring, an expensive cloud provider is not always necessary. Often, inexpensive VDS from reputable providers is sufficient.
- Optimize metric storage:
- Reduce
retention.timein Prometheus if old data is not needed. - Use downsampling (aggregation) for old metrics during long-term storage (e.g., in Thanos/Cortex).
- Avoid high metric cardinality, which inflates the size of the Prometheus database.
- Reduce
- Automate deployment: Use Ansible, Terraform, Puppet, or Chef for automatic installation and configuration of the Prometheus stack. This will reduce time for initial setup and subsequent updates.
- Use ready-made solutions: Don't reinvent the wheel. Use ready-made exporters, Grafana dashboards, and alerting rules from the community.
- Train your team: The more team members who know how to work with the monitoring system, the less workload on a single engineer, and the faster problems are resolved.
- Evaluate SaaS vs. Self-hosted: For very small projects with limited engineering resources, SaaS solutions may be more cost-effective at the start. But as the project grows and the number of hosts increases, a self-hosted Prometheus stack becomes significantly more economical, especially if you have internal expertise.
In 2026, the trend towards Open Source monitoring solutions remains strong, as they provide full control over data and help avoid vendor lock-in. Proper management of infrastructure and engineering time costs will allow you to create a powerful and cost-effective monitoring system.
9. Case Studies and Real-World Application Examples
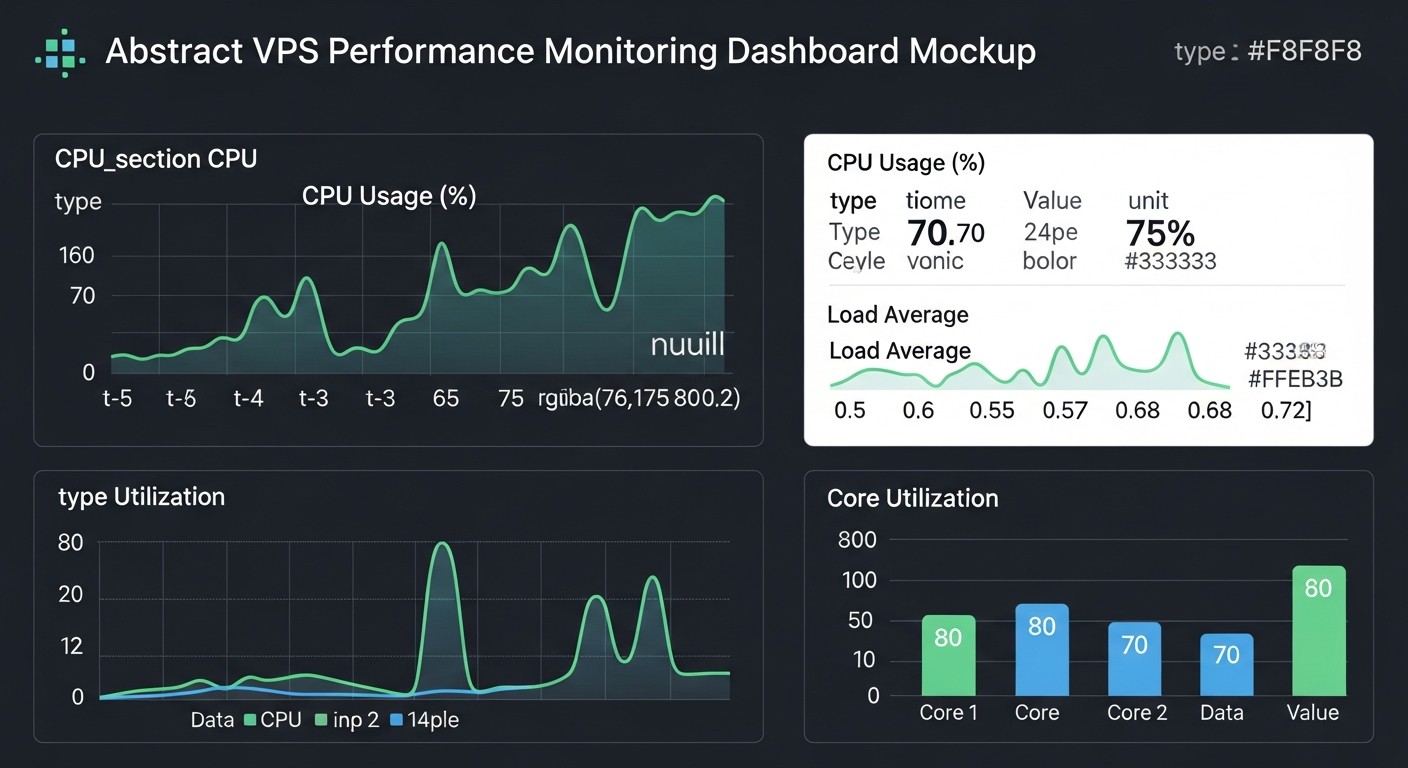
Theory is important, but in practice, the value of a monitoring system is revealed in real-world scenarios. Let's look at a few case studies demonstrating how Prometheus, Grafana, and Alertmanager help solve typical problems for DevOps engineers and developers.
9.1. Case 1: Small SaaS Project — Preventing Database Overload
Situation: A small SaaS project providing e-commerce analytics runs on a single VPS with PostgreSQL, Nginx, and a Node.js backend. Suddenly, users start complaining about slow service performance and sometimes 500 errors. The project is just starting to grow, and every client counts.
Solution with PGA Stack:
- Exporter Installation:
Node Exporter(for general OS metrics),PostgreSQL Exporter(for database metrics), andNginx Exporterwere installed on the VPS. - Prometheus Configuration: Prometheus was configured to collect metrics from all exporters.
- Grafana Dashboards: Dashboards were created:
- "VPS Overview" (CPU, RAM, Disk I/O, Network from Node Exporter).
- "PostgreSQL Health" (active connections, locks, slow queries, cache hits from PostgreSQL Exporter).
- "Nginx Performance" (request count, response time, 5xx errors from Nginx Exporter).
- Alertmanager Rules: The following alerts were configured:
PostgreSQLHighActiveConnections: If the number of active connections to PostgreSQL exceeds 80% of the limit for 5 minutes (severity: warning).PostgreSQLSlowQueries: If the average query execution time increases by 20% within 10 minutes (severity: warning).Nginx5xxErrors: If the number of Nginx 5xx errors exceeds 5% of the total requests within 1 minute (severity: critical).
Result: After configuring the monitoring system, during peak load, the PostgreSQLHighActiveConnections alert fired. The engineer, receiving the notification in Slack, immediately opened the "PostgreSQL Health" dashboard and saw that the number of connections was indeed approaching the limit, and there was also an increase in slow queries. Log and metric analysis showed that one of the analytical reports, run on a schedule, was creating excessive load on the database. Developers promptly optimized the query and moved its execution to a less busy time. The problem was resolved before it led to a complete service failure, preserving customer loyalty and preventing reputational damage.
9.2. Case 2: Growing Project with Microservices — Detecting a "Silent" Failure
Situation: The project has grown to several VPS, hosting microservices (e.g., in Node.js and Go) in Docker containers. One of the services, responsible for processing background tasks (e.g., sending notifications), started behaving incorrectly: tasks are queued but not processed, while the container itself is "alive" and not showing explicit errors.
Solution with PGA Stack:
- Application Metric Integration: Developers integrated the Prometheus client library into the Node.js and Go service code. Custom metrics were added:
app_queue_size: Number of tasks in the queue.app_processed_tasks_total: Total number of processed tasks.app_worker_status: Worker status (0 - inactive, 1 - active).
- cAdvisor for Containers:
cAdvisorwas installed to collect resource usage metrics for each container. - Dashboards and Alerts:
- "Microservice Health" dashboard with graphs for
app_queue_sizeandrate(app_processed_tasks_total[1m]). - Alert
BackgroundTaskQueueStalled: Ifapp_queue_size> 100 andrate(app_processed_tasks_total[5m]) == 0(i.e., queue is growing, but no tasks are being processed) for 5 minutes (severity: critical). - Alert
WorkerInactive: Ifapp_worker_status == 0for 1 minute (severity: warning).
- "Microservice Health" dashboard with graphs for
Result: One day, when a third-party library was updated, one of the background task workers froze but did not crash. It continued to consume minimal resources, and Node Exporter did not detect any issues. However, after 5 minutes, the BackgroundTaskQueueStalled alert fired. Developers immediately saw the growing queue and zero task processing rate on the dashboard. Quickly checking the logs, they found that the worker was stuck processing a malformed message. The service was restarted, the malformed message was removed from the queue, and operations resumed. This case demonstrates how monitoring application-specific metrics allows detecting problems not visible at the OS level and preventing data loss or processing delays.
9.3. Case 3: Cost and Resource Optimization — Identifying Inefficient RAM Usage
Situation: A SaaS project founder is concerned about rising VPS bills. The infrastructure consists of several identical VPS, and there is a suspicion that some of them are over-provisioned.
Solution with PGA Stack:
- Metric Collection:
Node Exportermetrics (especiallynode_memory_MemTotal_bytes,node_memory_MemFree_bytes,node_memory_Buffers_bytes,node_memory_Cached_bytes) are actively collected on all VPS. - Grafana Analytical Dashboard: A "Resource Utilization Overview" dashboard was created, showing aggregated and individual graphs of CPU, RAM, Disk I/O usage for all VPS. PromQL queries were used to calculate actual used memory (Total - Free - Buffers - Cache).
- Long-Term Storage: Long-term storage of RAM metrics in Thanos was configured for trend analysis over the past 6 months.
Result: Analysis of Grafana dashboards and long-term trends showed that 3 out of 5 VPS consistently used less than 30% of allocated RAM, even during peak hours. After consulting with developers, it was found that these VPS were provisioned with extra capacity "just in case." Based on this data, a decision was made to reduce the RAM on these three VPS from 8 GB to 4 GB. This led to an immediate saving of $60 per month (approximately $720 per year) without any negative impact on service performance. Monitoring allowed for an informed decision on infrastructure optimization, turning "vague suspicions" into concrete figures and actions.
These case studies demonstrate that the PGA stack is not just a set of tools, but a complete system that allows not only reacting to problems but also actively preventing them, optimizing resources, and making strategic decisions based on data.
10. Tools and Resources for Advanced Monitoring
In addition to the core components Prometheus, Grafana, and Alertmanager, there is an extensive ecosystem of tools and resources that can significantly expand the capabilities of your monitoring system. In 2026, these tools continue to evolve, offering new ways to collect, analyze, and visualize data.
10.1. Additional Utilities for Working with Prometheus
- Promtool: A built-in command-line utility for Prometheus, used to check configuration files (
promtool check config) and alerting rules (promtool check rules). An indispensable tool for debugging. - PromLens / PromQL Editor: Advanced PromQL editors offering autocompletion, syntax highlighting, query tree visualization, and other features that simplify writing complex queries. Some of them are integrated into Grafana.
- Prometheus Operator: For those using Kubernetes, Prometheus Operator automates the deployment, configuration, and management of Prometheus and Alertmanager. Significantly simplifies life in containerized environments.
10.2. Tools for Long-Term Storage and Scaling
As mentioned earlier, Prometheus by default is not designed for unlimited long-term storage. For this, specialized solutions exist:
- Thanos: A set of components that transforms multiple Prometheus instances into a globally scalable monitoring system with long-term storage in object storage (S3). Allows querying metrics from multiple Prometheus servers, aggregating them, and storing historical data.
- Cortex: Another project for creating a horizontally scalable, highly available, multi-tenant Prometheus metrics store. Also uses S3 for long-term storage.
- VictoriaMetrics: A high-performance, scalable, and cost-effective time series database, compatible with Prometheus. Can be used as remote storage for Prometheus or as a standalone Prometheus-compatible metric collection server.
The choice between Thanos, Cortex, and VictoriaMetrics depends on your infrastructure, scalability requirements, and team preferences. In 2026, all three solutions are actively developing and offer mature features.
10.3. Log Monitoring and Tracing
Monitoring metrics is only part of the picture. For a complete understanding of the system's state, logs and tracing are also necessary.
- Loki (Log aggregation): A project from Grafana Labs, positioned as "Prometheus for logs." Loki indexes only labels from logs, not their content, which makes it very efficient and cost-effective. Integrates with Grafana via the Loki plugin. The Promtail agent is used for log collection.
- ELK Stack (Elasticsearch, Logstash, Kibana): A traditional solution for collecting, storing, and analyzing logs. Powerful, but more resource-intensive and complex to manage than Loki.
- Grafana Tempo (Distributed Tracing): A system for collecting and storing traces, which also integrates with Grafana. Allows tracking a request's path through many microservices, identifying bottlenecks and latencies.
- OpenTelemetry: A universal standard for collecting telemetry (metrics, logs, traces) from applications. Allows instrumenting code once and sending data to various backends (Prometheus, Loki, Tempo, Jaeger, etc.). In 2026, OpenTelemetry is becoming the de facto standard for application instrumentation.
10.4. Useful Links and Documentation
- Official Prometheus Documentation: A comprehensive source of information on all aspects of Prometheus.
- Official Grafana Documentation: Detailed guides on configuring dashboards, data sources, and other features.
- Official Alertmanager Documentation: Everything about grouping, routing, and alert integrations.
- Grafana Labs Dashboard Library: A huge collection of ready-made dashboards that can be imported and adapted to your needs.
- Awesome Prometheus: A curated list of exporters, tools, articles, and resources related to Prometheus.
- PromLabs Blog: A blog from Prometheus experts with in-depth articles on PromQL, architecture, and best practices.
- Robust Perception Blog: Another excellent resource with high-quality articles on Prometheus.
Active use of these resources and tools will allow you to build not just a monitoring system, but a full-fledged observability platform that will provide deep insight into your systems and help you make more informed decisions.
11. Troubleshooting: Solving Common Problems
Even with the most careful configuration, problems can arise in the monitoring system. Knowing common scenarios and diagnostic methods will help you quickly restore functionality or find the root cause of an issue.
11.1. Prometheus Not Collecting Metrics (Targets DOWN)
Symptoms: In the Prometheus web interface (http://your_vps_ip:9090/targets), one or more targets appear as DOWN.
Possible causes and solutions:
- Exporter Unavailability:
- Check: Try to retrieve metrics directly from the browser or using
curl:curl http://target_ip:exporter_port/metrics(e.g.,http://localhost:9100/metricsfor Node Exporter). If no response is received or a 404/500 error occurs, the problem is with the exporter itself. - Solution: Check if the exporter container/process is running (
docker psorsystemctl status node_exporter). Look at the exporter logs (docker logs node_exporter). Ensure the exporter is listening on the correct port.
- Check: Try to retrieve metrics directly from the browser or using
- Network/Firewall Issues:
- Check: Ensure Prometheus can reach the exporter. If Prometheus and the exporter are on different hosts, check network connectivity (
ping target_ip) and firewall rules (sudo ufw statusor cloud provider rules). - Solution: Open the necessary port (e.g., 9100 for Node Exporter) on the host with the exporter for the Prometheus server's IP address.
- Check: Ensure Prometheus can reach the exporter. If Prometheus and the exporter are on different hosts, check network connectivity (
- Error in Prometheus Configuration:
- Check: Run
promtool check config /etc/prometheus/prometheus.yml. Check thescrape_configssection inprometheus.ymlfor typos in addresses or ports. - Solution: Correct the configuration, restart Prometheus (
docker compose restart prometheus).
- Check: Run
11.2. Grafana Not Displaying Data or Showing Errors
Symptoms: Dashboards are empty, graphs are not drawn, errors like "Cannot connect to Prometheus" or "No data points" appear.
Possible causes and solutions:
- Prometheus Unavailable:
- Check: Ensure Prometheus is running and accessible at the address specified in Grafana's data source settings (
http://prometheus:9090if in Docker Compose). Try navigating to this address in your browser. - Solution: If Prometheus is unavailable, see the "Prometheus Not Collecting Metrics" section.
- Check: Ensure Prometheus is running and accessible at the address specified in Grafana's data source settings (
- Incorrect PromQL Query:
- Check: Open the Grafana panel in edit mode, copy the PromQL query, and paste it into the Prometheus web interface (
http://your_vps_ip:9090/graph). See if it returns data. - Solution: Correct the PromQL query. Ensure that metrics with such labels actually exist (use autocompletion in the Prometheus UI).
- Check: Open the Grafana panel in edit mode, copy the PromQL query, and paste it into the Prometheus web interface (
- Grafana Data Source Issues:
- Check: In Grafana, go to Configuration -> Data Sources -> Prometheus. Click "Save & Test". If there's an error, it will be displayed.
- Solution: Correct the URL, check network connectivity between Grafana and Prometheus containers.
11.3. Alertmanager Not Sending Alerts
Symptoms: Prometheus shows active alerts, but notifications are not received in Slack, Telegram, or email.
Possible causes and solutions:
- Alertmanager Configuration Problem:
- Check: Run
promtool check config /etc/alertmanager/alertmanager.yml. Check the Alertmanager web interface (http://your_vps_ip:9093/#/alerts) to see which alerts it received from Prometheus. Check thereceiversandroutessections. - Solution: Correct the syntax, verify the correctness of Webhook URLs, API keys. Restart Alertmanager (
docker compose restart alertmanager).
- Check: Run
- Integration Issues (Slack, Telegram, email):
- Check: For Slack/Telegram Webhook URL: try sending a test request using
curl. For email: check SMTP server settings, Alertmanager logs for SMTP connection errors. - Solution: Ensure Webhook URL or SMTP settings are correct and have not expired. Check spam folder for emails.
- Check: For Slack/Telegram Webhook URL: try sending a test request using
- Alerts are being inhibited/grouped:
- Check: In the Alertmanager web interface, check the "Silences" and "Inhibitions" tabs. The alert might be falling under an inhibition rule or manually silenced.
- Solution: Remove unnecessary silences/inhibitions. Review the
group_by,group_wait,group_interval,repeat_intervalrules inalertmanager.yml.
11.4. High Load on Prometheus Server
Symptoms: Prometheus consumes a lot of CPU or RAM, disk fills up quickly, PromQL queries execute slowly.
Possible causes and solutions:
- High Metric Cardinality:
- Check: In Prometheus UI, go to Status -> TSDb Status. Look at the number of Series and their growth. If the number of series is very high (millions) and growing rapidly, this indicates high cardinality.
- Solution: Review exporters to avoid labels with unique values (UUIDs, session IDs, full URLs with parameters). Use
relabel_configsinprometheus.ymlto filter or rewrite labels.
- Frequent Metric Collection:
- Check: Check
scrape_intervalinprometheus.yml. - Solution: Increase
scrape_intervalfor less critical targets (e.g., to 60 seconds).
- Check: Check
- Too Long Data Retention:
- Check: Check
--storage.tsdb.retention.timein the Prometheus startup command. - Solution: Reduce retention time or consider implementing Thanos/Cortex/VictoriaMetrics for long-term storage.
- Check: Check
- Inefficient Queries in Grafana:
- Check: If the load increases when opening certain dashboards, the problem lies there.
- Solution: Optimize PromQL queries in Grafana. Use
sum by (...)instead ofsum()if aggregation by labels is needed.
11.5. When to Contact Support
If you have exhausted all self-diagnosis options and the problem persists, it might be time to seek help:
- To your VPS provider: If there are suspicions of VPS hardware issues, network connectivity problems at the data center level, or if your VPS is unreachable at the OS level.
- To the Prometheus/Grafana community: For general configuration questions, complex PromQL queries, or architectural decisions. Use forums, Slack channels, or Stack Overflow.
- To experts/consultants: For complex, non-standard tasks, auditing an existing system, or if your team lacks sufficient expertise in the Prometheus stack. This may be a paid service, but it often pays off by quickly resolving the problem and gaining expertise.
Remember, logs are your best friend. Always start diagnosis by reviewing the logs of the relevant components (Prometheus, Grafana, Alertmanager, exporters) via docker logs or journalctl -u .
12. FAQ: Frequently Asked Questions about Prometheus, Grafana, and Alertmanager
12.1. What is the main difference between Prometheus and Zabbix?
The main difference lies in the metric collection model and approach. Prometheus uses a pull model (it scrapes targets itself) and is oriented towards time series with labels, which provides high query flexibility using PromQL. Zabbix uses a push model (agents send data) and a more traditional monitoring approach based on data items and triggers. Prometheus is better suited for dynamic cloud and containerized environments, while Zabbix is for more static enterprise infrastructures.
12.2. How much disk space does Prometheus need?
Prometheus's disk space consumption heavily depends on the number of metrics collected (series), their collection frequency, and retention duration. Approximately, for 10,000 active metric series collected every 15 seconds and data stored for 30 days, about 50-100 GB will be needed. For larger systems or longer retention, significantly more will be required, so using remote storage like Thanos/Cortex/VictoriaMetrics with S3 is recommended.
12.3. How to monitor logs with the Prometheus stack?
Prometheus is not designed for log collection. For this, a separate tool is used, such as Loki from Grafana Labs (often called "Prometheus for logs"). Loki collects logs using the Promtail agent, indexes them by labels (similar to Prometheus), and allows querying them through Grafana. Alternatives include the ELK Stack (Elasticsearch, Logstash, Kibana) or other centralized logging systems.
12.4. Can Docker containers be monitored?
Yes, Prometheus is excellent for monitoring Docker containers. The most common way is to use cAdvisor (Container Advisor), which collects and exports resource usage metrics (CPU, RAM, network, disk) for each container running on the host. These metrics are then collected by Prometheus and visualized in Grafana.
12.5. How to ensure high availability of the monitoring system?
For high availability of Prometheus, several approaches can be used:
- Two Prometheus Instances: Run two independent Prometheus instances collecting the same metrics.
- Thanos/Cortex/VictoriaMetrics: These solutions are inherently designed for high availability and horizontal scaling, using object storage as a single source of truth.
- Alertmanager: Run Alertmanager in a cluster to avoid a single point of failure for alerts.
- Grafana: Run Grafana in a cluster and use a shared database for configuration storage.
12.6. What are the best practices for writing PromQL queries?
Key PromQL best practices:
- Use
rate()orirate()for counters. - Avoid high label cardinality.
- Use
by()for aggregation by specific labels. - Test queries in the Prometheus UI before adding them to Grafana/alerts.
- Document complex queries.
- Use
sum(rate(...))to aggregate metrics across all instances.
12.7. How to monitor external services (e.g., website availability)?
For monitoring external services, Blackbox Exporter is used. It allows checking HTTP/HTTPS endpoints, TCP ports, performing ICMP pings, and DNS queries. Prometheus scrapes Blackbox Exporter, passing it the target to check, and Blackbox Exporter returns metrics about the availability and response time of that target.
12.8. Can Prometheus be used for business metrics?
Yes, Prometheus is excellent for collecting and analyzing business metrics. You can instrument your applications using Prometheus client libraries to export metrics such as number of registrations, active users, completed transactions, average order value, etc. These metrics can then be visualized in Grafana and alerts configured on them.
12.9. How to update Prometheus stack components?
If you are using Docker Compose, updating components is quite simple:
- Change the image tags in
docker-compose.ymlto the new versions. - Execute
docker compose pullto download the new images. - Execute
docker compose up -dto restart the containers with the new images.
12.10. What resources are needed for monitoring in 2026?
In 2026, resource requirements for monitoring continue to grow due to increasing data volume and system complexity. For an average VPS with 10-20 targets and 30-day retention, it is recommended to have a minimum of 4 CPU, 8 GB RAM, and 200 GB SSD. For larger systems or using long-term storage with Thanos/Cortex/VictoriaMetrics, additional resources are required for these components and object storage.
13. Conclusion: Your Next Steps to Reliable Monitoring
In 2026, when service stability and performance are the cornerstone of any successful project, especially for SaaS businesses and growing startups, a reliable monitoring system is not just an option, but an absolute necessity. We have thoroughly examined how the combination of Prometheus for metric collection, Grafana for their visualization, and Alertmanager for smart alert management forms a powerful, flexible, and cost-effective solution for monitoring VPS and applications.
We have covered everything from understanding critically important metrics to step-by-step installation and configuration, reviewed common mistakes and methods for preventing them, analyzed the economics of ownership, and explored real-world case studies. You have seen that Open Source solutions, such as the PGA stack, allow achieving a level of control and customization that is often unavailable in proprietary SaaS solutions, while significantly reducing long-term licensing costs.
Final Recommendations:
- Start small, but correctly: Don't try to monitor everything at once. Start with basic OS metrics (Node Exporter) and key metrics of your applications. Gradually expand coverage.
- Automate: Use Docker Compose, Ansible, or Terraform to deploy and manage your monitoring system. This will save time and reduce errors.
- Be proactive: Configure alerts for early signs of problems, not just critical failures. Use
forin Prometheus rules and smart grouping in Alertmanager to avoid "alert fatigue." - Visualize: Use Grafana to create informative dashboards that help quickly understand system status and identify anomalies.
- Document: Create Runbooks for each important alert. Knowing what to do when an alert fires reduces Mean Time To Recovery (MTTR).
- Learn and evolve: The Prometheus ecosystem is constantly developing. Study PromQL, new exporters, long-term storage solutions (Thanos, Cortex, VictoriaMetrics), and logging and tracing tools (Loki, Tempo).
- Monitor the monitoring itself: Ensure your monitoring system is working correctly and alerts you if something goes wrong with it.
Your Next Steps:
- Deploy the basic stack: Use the
docker-compose.ymland configurations provided in this article to deploy Prometheus, Grafana, Alertmanager, and Node Exporter on your VPS. - Configure your first alerts: Adapt the
alert.rules.ymlrules to your thresholds and alerting channels. - Import dashboards: Find and import pre-built dashboards for Node Exporter and other technologies you use into Grafana.
- Instrument your applications: Start adding custom metrics to your backend code to gain deep insights into the operation of your services.
- Gradually expand: Add Blackbox Exporter for external monitoring, cAdvisor for containers, specialized exporters for databases and web servers.
Remember that monitoring is a continuous process. It requires attention, iterations, and constant adaptation to the changing demands of your infrastructure and applications. Investing in quality monitoring today will pay off handsomely, ensuring stability, reliability, and peace of mind for your team and your users in the future.
Was this guide helpful?
