Optimizing High-Performance AI/ML Inference on GPU: Triton Inference Server and Best Practices (2026)
TL;DR
- Triton Inference Server is the de-facto standard for high-performance AI/ML inference on GPU, ensuring low latency and high throughput through batch processing, model parallelism, and dynamic loading.
- Key success factors in 2026 include choosing the right GPU (NVIDIA Blackwell B200/GB200 or AMD Instinct MI400), effective model quantization (INT8, FP8), and using advanced compilation techniques (TensorRT).
- Scaling inference is best achieved through Kubernetes with operators like KServe or Seldon Core, which allows for dynamic resource management and ensures fault tolerance.
- Monitoring and profiling are critically important: Prometheus, Grafana, and NVIDIA DCGM will help identify performance bottlenecks and optimize GPU utilization.
- Cost savings are achieved through precise selection of GPU instances, aggressive model optimization, using cloud spot instances, and efficient model lifecycle management.
- Common mistakes include underestimating deployment complexity, ignoring model optimization before deployment, lacking adequate monitoring, and incorrect batch processing configuration.
- The future of inference is moving towards multimodal and ultra-large models, requiring distributed inference and even more sophisticated strategies for optimizing memory and computation usage.
Introduction
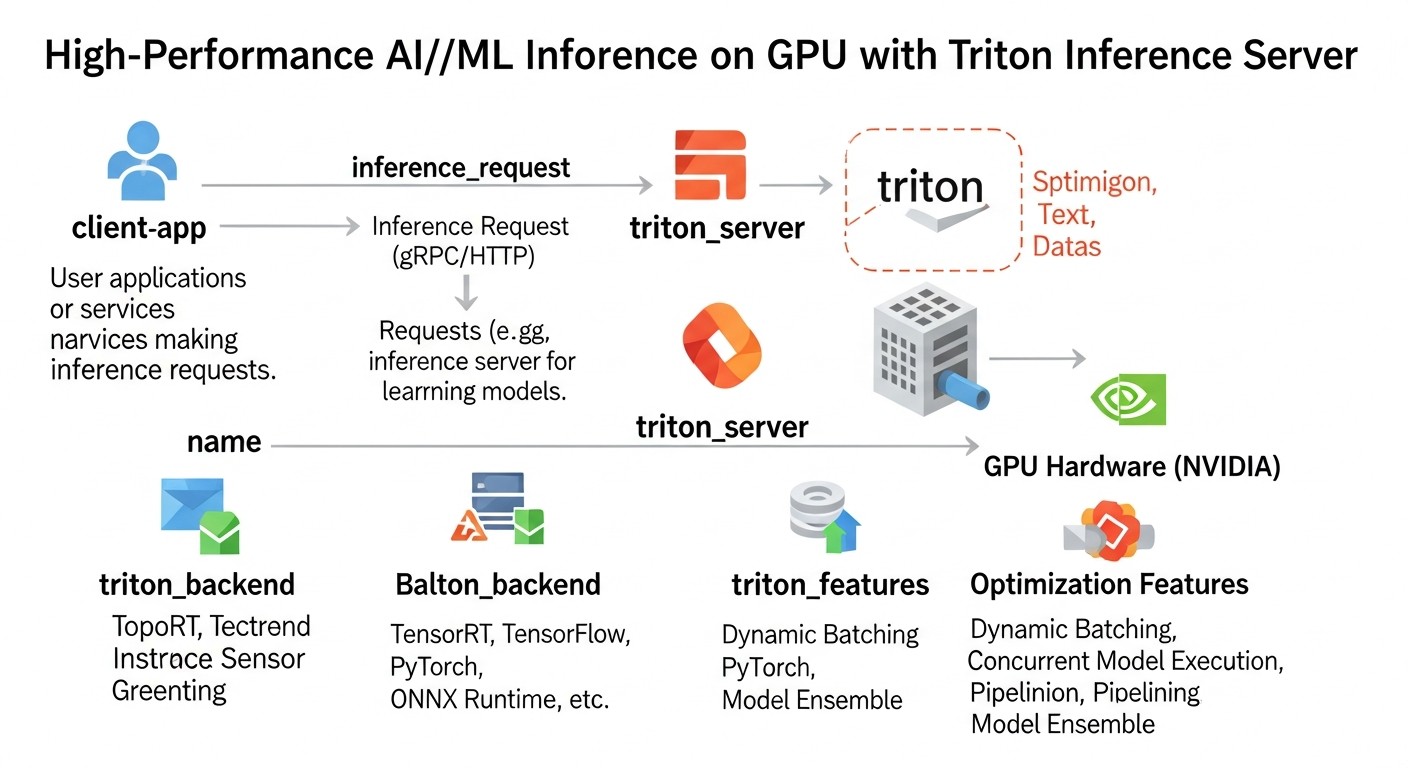 Diagram: Introduction
In 2026, as artificial intelligence and machine learning have become an integral part of almost every industry, from autonomous transport to personalized medicine, a critically important aspect is not only the development of powerful models but also their efficient deployment. High-performance GPU inference is not just a desirable feature but a strict requirement for most modern AI applications. Users expect instant responses, and businesses demand scalability and cost-effectiveness.
The challenges faced by teams are numerous: how to serve millions of requests per second with minimal latency? How to make the most efficient use of expensive GPU resources? How to manage dozens or hundreds of different models, each with its own framework and version requirements? How to ensure high availability and fault tolerance under constantly growing load?
This article is addressed to DevOps engineers, backend developers, SaaS project founders, system administrators, and CTOs of startups who aim to build a reliable, scalable, and cost-effective infrastructure for AI/ML inference. We will focus on NVIDIA Triton Inference Server as the gold standard in this area, providing a deep analysis of its capabilities, best practices, and specific examples relevant to the technological landscape of 2026.
We will cover not only the technical aspects of Triton but also broader issues such as hardware selection, model optimization, integration with orchestrators like Kubernetes, monitoring, and cost management. The goal is to provide you with a comprehensive guide that will enable you to make informed decisions and successfully implement high-performance inference in your projects.
Key Criteria and Optimization Factors for High-Performance Inference
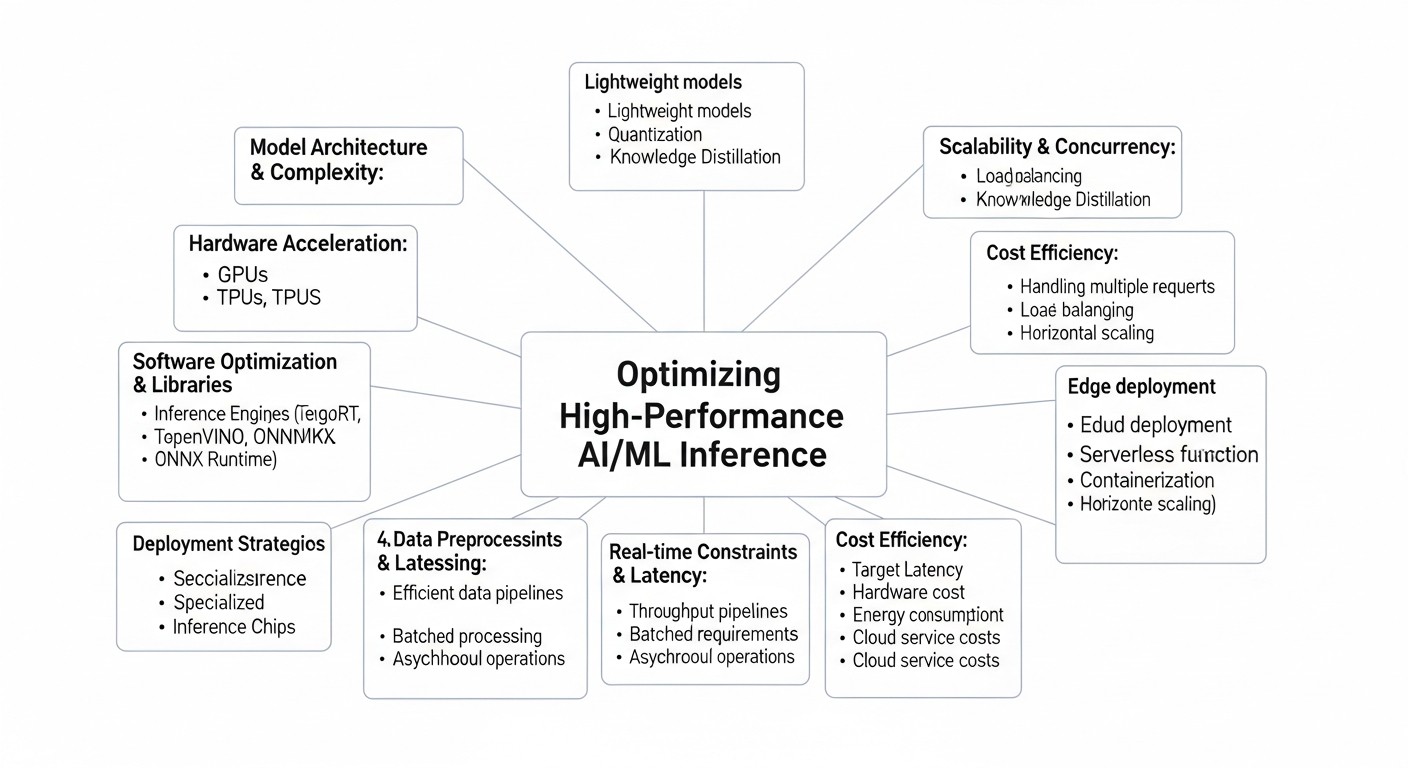 Diagram: Key Criteria and Optimization Factors for High-Performance Inference
To achieve optimal performance and efficiency of AI/ML inference on GPU, many factors must be considered. Each plays a key role in the overall architecture and can become both a bottleneck and a powerful lever for optimization. Let's examine them in detail.
1. Latency
Latency is the time it takes to receive a response from the model after sending a request. For interactive applications (e.g., chatbots, real-time recommendation systems, autonomous driving), low latency is critically important. Users expect responses within tens or hundreds of milliseconds. High latency leads to a poor user experience and can render a product unusable.
- Why it's important: Directly impacts UX, especially in real-time scenarios.
- How to evaluate: Measured in milliseconds (ms). It's important to look at p90, p95, p99 latency, not just the average, to account for outliers.
- Influencing factors: Model size, computational complexity, GPU type, batch size, network latency, inference server overhead.
2. Throughput
Throughput is the number of requests a system can process per unit of time (e.g., requests per second). This is a key metric for high-load systems that need to serve a large number of parallel requests, such as processing images, video streams, or text documents.
- Why it's important: Determines system scalability and the ability to handle peak loads.
- How to evaluate: Measured in requests per second (RPS) or inferences per second.
- Influencing factors: Number of GPUs, their computational power, batch size, parallelization efficiency, I/O overhead.
3. GPU Utilization
Efficient GPU utilization is about maximizing the computational power of expensive hardware. Low utilization means you are paying for idle resources. The goal is to keep the GPU loaded as close to 100% as possible without sacrificing latency.
- Why it's important: Directly impacts operational costs. Insufficient utilization is lost money.
- How to evaluate: Monitoring GPU utilization (SM utilization, memory utilization) using tools like
nvidia-smi, DCGM.
- Influencing factors: Batch size, number of parallel models, efficiency of task scheduling on the GPU, CPU overhead, data transfer speed.
4. Cost-Effectiveness
The ratio of performance to cost. This includes not only direct GPU costs but also expenses for electricity, cooling, maintenance, licenses (if applicable), and engineer salaries. In 2026, with the emergence of more powerful and specialized GPUs such as NVIDIA Blackwell B200/GB200 or AMD Instinct MI400, their high cost makes the issue of economic efficiency even more acute.
- Why it's important: Determines the long-term viability and profitability of an AI product.
- How to evaluate: Calculation of TCO (Total Cost of Ownership) and metrics like "cost per inference" or "cost per 1000 requests."
- Influencing factors: Hardware choice (cloud/on-premise, GPU type), model optimization, efficient scaling, use of spot instances.
5. Framework/Model Support
Modern AI systems often use models developed with various frameworks (TensorFlow, PyTorch, ONNX, JAX, Hugging Face Transformers) and in different formats. The inference server must provide flexibility in working with this diversity.
- Why it's important: Allows centralized deployment management, avoiding a sprawl of separate services for each model.
- How to evaluate: List of supported frameworks and model formats, ease of adding new ones.
- Influencing factors: Inference server architecture (modular, plug-in), availability of ready-made backends.
6. Scalability
The ability of a system to increase or decrease its resources depending on changes in load. This includes both horizontal scaling (adding new server instances) and vertical scaling (using more powerful GPUs or multiple GPUs on one instance).
- Why it's important: Ensures stable operation during peak loads and resource savings during periods of low activity.
- How to evaluate: Load testing, ability to integrate with orchestrators (Kubernetes).
- Influencing factors: Application architecture, containerization, use of Kubernetes, autoscaling policies.
7. Ease of Deployment & Management
The complexity of setting up, deploying, updating, and monitoring models and the inference server itself. The simpler these processes are, the less time and resources are required from the DevOps team.
- Why it's important: Reduces operational costs and accelerates the development/deployment cycle.
- How to evaluate: Time required to deploy a new model, configuration complexity, availability of management APIs.
- Influencing factors: Documentation, ready-made Docker images, Helm charts, availability of management APIs.
8. Reliability & Fault Tolerance
The ability of a system to continue functioning even when individual components fail. This is critical for production systems where downtime can lead to significant financial losses.
- Why it's important: Ensures service continuity and prevents data or revenue loss.
- How to evaluate: Recovery Time Objective (RTO), Recovery Point Objective (RPO), failure testing.
- Influencing factors: Use of orchestrators (Kubernetes), load balancers, component redundancy, self-healing mechanisms.
9. Security
Protection of models, data, and infrastructure from unauthorized access, modification, or leakage. Includes authentication, authorization, encryption of data in transit and at rest.
- Why it's important: Protection of intellectual property (models), confidential client data, and compliance with regulatory requirements (GDPR, HIPAA).
- How to evaluate: Availability of authentication/authorization mechanisms, TLS support, resource isolation.
- Influencing factors: Integration with corporate security systems, use of containers with minimal privileges, regular security audits.
10. Model Versioning & A/B Testing
The ability to manage different versions of a single model, smoothly switch between them, and direct a portion of traffic to a new version for testing before full deployment.
- Why it's important: Allows safe model updates, conducting experiments, and minimizing deployment risks.
- How to evaluate: Availability of built-in versioning and traffic routing mechanisms, integration with CI/CD pipelines.
- Influencing factors: Inference server functionality, Kubernetes Ingress/Service Mesh support.
Comparative Table of GPU Inference Approaches (2026)
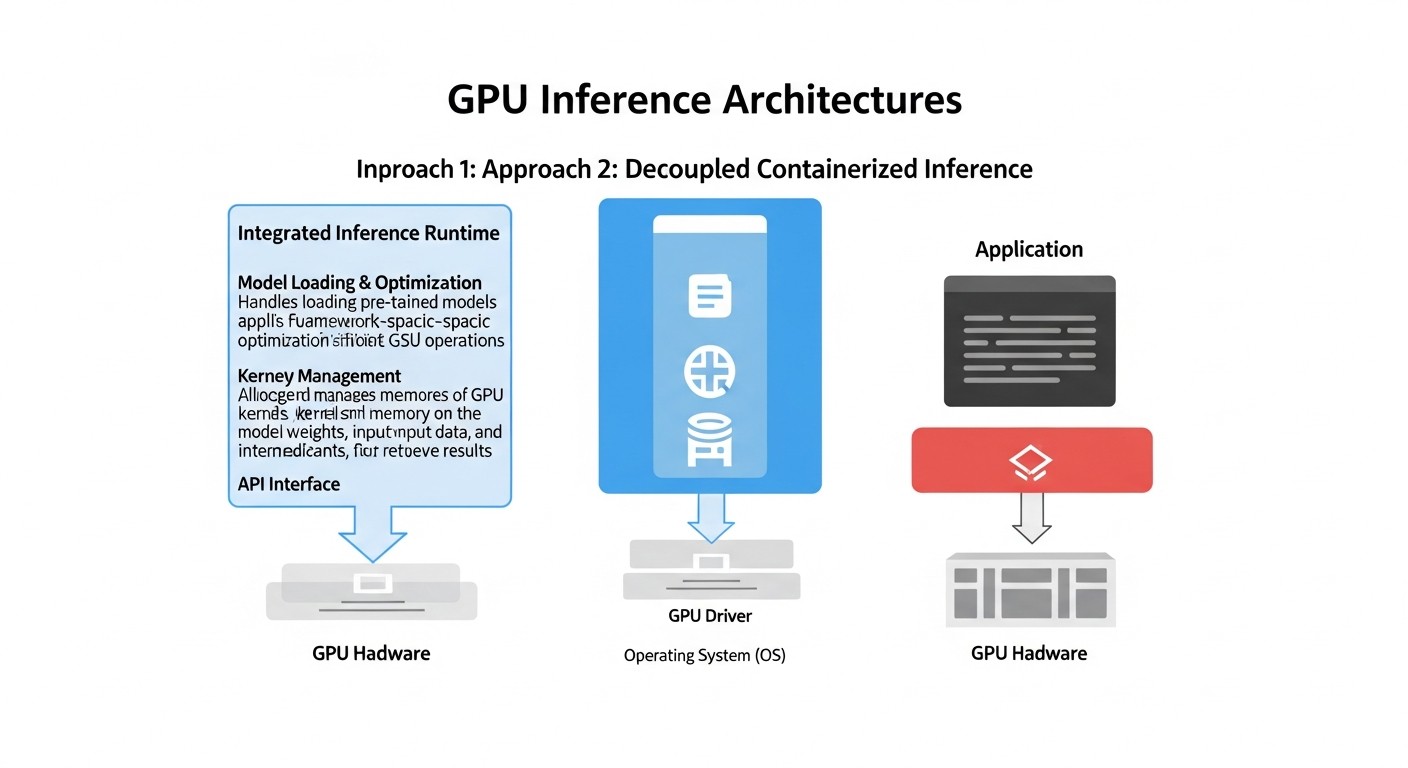 Diagram: Comparative Table of GPU Inference Approaches (2026)
Choosing the right approach for deploying AI/ML models on GPUs is critically important. In 2026, several mature strategies exist, each with its strengths and weaknesses. In this table, we compare the most common options, considering current technologies and pricing realities.
| Criterion |
"Raw" API (FastAPI + PyTorch/TF) |
ONNX Runtime Inference Server |
NVIDIA Triton Inference Server |
KServe / Seldon Core (on Kubernetes) |
| Latency |
Medium (depends on custom optimization, no dynamic batching) |
Low (optimized for ONNX, efficient CPU/GPU operation) |
Very Low (dynamic batching, multi-model parallelism, TensorRT) |
Low (uses Triton/ONNX RT/TF Serving under the hood, but with additional Kubernetes overhead) |
| Throughput |
Medium (requires manual batching implementation) |
High (efficient resource utilization) |
Very High (maximum GPU utilization, parallel requests) |
Very High (Kubernetes horizontal scaling, autoscaling) |
| GPU Utilization |
Medium (may be suboptimal without manual tuning) |
High (well optimized) |
Very High (dynamic batching, scheduler, multi-GPU) |
High (efficient resource allocation via Kubernetes) |
| Deployment Complexity |
Low for simple models, high for optimization |
Medium (ONNX format required) |
Medium-High (model configuration, backends) |
High (requires deep Kubernetes knowledge) |
| Framework Support |
Any (as code is written manually) |
ONNX (conversion from PyTorch/TF/etc.) |
TensorFlow, PyTorch, ONNX, TensorRT, OpenVINO, custom backends |
Any (via integration with TF Serving, PyTorch Serve, Triton, ONNX RT) |
| Scalability |
Manual horizontal scaling, no GPU autoscaling |
Horizontal scaling of instances |
Horizontal scaling of instances, internal multi-GPU |
Automatic horizontal and vertical scaling on Kubernetes |
| Versioning/A/B Testing |
Manual implementation |
Via deploying different instances |
Via different models/versions in one server, traffic management by external means |
Built-in mechanisms (KServe/Seldon) |
| Estimated Cost (2026, for 10M inferences/month on NVIDIA H200/B200 GPU) |
$500 - $2000 (depends on optimization and instance selection) |
$400 - $1800 (due to better utilization) |
$300 - $1500 (optimal GPU utilization, high throughput) |
$600 - $2500 (additional Kubernetes overhead, but with better automation) |
Note: The indicated costs are estimated for 2026 and may vary depending on the cloud provider, region, instance type, data volume, and model complexity. They include only the cost of GPU instances, excluding the cost of CPU, storage, network, and other services.
Detailed Overview of Each Item/Option
Now let's delve into each of the approaches presented in the comparison table to understand their features, advantages, disadvantages, and application scenarios.
1. "Raw" API (FastAPI + PyTorch/TensorFlow/JAX)
This approach involves creating your own HTTP API service using lightweight web frameworks such as FastAPI (for Python), Express.js (for Node.js), or Gin (for Go), which directly loads and runs the model. The model is usually wrapped in PyTorch, TensorFlow, or JAX.
Pros:
- Full Control: You have complete control over every aspect of deployment, from request processing to model loading and inference logic. This allows for the implementation of any specific logic.
- Simplicity to Start: For simple, small models, especially at the project's inception, this is the fastest way to get a model into production, as it doesn't require learning complex inference frameworks.
- Framework Flexibility: Supports absolutely any ML framework or library that can be run in your environment.
- Low Initial Overhead: No need for additional dependencies beyond the ML framework itself and a web server.
Cons:
- Lack of Out-of-the-Box Optimizations: Dynamic batching, model parallelism, efficient GPU memory management, multi-GPU inference — all of this must be implemented manually, requiring significant effort and expert knowledge.
- Scaling Complexity: Scaling becomes complex as there are no built-in mechanisms for optimal GPU utilization. Often leads to low utilization of expensive GPU resources.
- High Latency and Low Throughput: Without advanced techniques like dynamic batching, each model processes requests sequentially or with a suboptimal batch size, which increases latency and reduces overall throughput.
- Lack of Standardization: Each model may require its own unique service, leading to a "zoo" of services and complicating management and monitoring.
Who it's suitable for:
This approach is ideal for early-stage startups that need to quickly test a hypothesis with one or two simple models that do not require extreme performance. It is also suitable for very specific tasks where standard inference servers cannot provide the necessary customization, and the team is willing to invest in developing their own optimizations. However, as the load grows or the number of models increases, it becomes necessary to switch to more specialized solutions.
2. ONNX Runtime Inference Server
ONNX (Open Neural Network Exchange) Runtime is a cross-platform inference accelerator developed by Microsoft that supports models in the ONNX format. ONNX Runtime Inference Server provides a ready-made wrapper for serving such models.
Pros:
- High Performance: ONNX Runtime itself is highly optimized and can provide low latency and high throughput, especially for CPU. It also performs well on GPU, utilizing CUDA.
- Cross-Platform: Models in ONNX format can be run on various devices and operating systems, providing deployment flexibility.
- Support for Multiple Frameworks: Models from PyTorch, TensorFlow, Keras, Scikit-learn, and other frameworks can be converted to ONNX format.
- Ease of Deployment: The server is relatively simple to set up and use if you already have models in ONNX format.
- Efficient Resource Utilization: ONNX Runtime includes various optimizations, such as graph transformations and optimal operator selection, which contribute to efficient use of both CPU and GPU.
Cons:
- Requires ONNX Conversion: Not all models convert perfectly to ONNX, and the conversion process can be laborious, especially for complex or custom operations.
- Fewer Deep GPU Optimizations: While ONNX Runtime supports GPU, it may not achieve the same level of deep optimizations (e.g., TensorRT) as specialized inference servers like Triton, especially for the most demanding scenarios.
- Limited Capabilities for Complex Scenarios: For multi-model inference, model ensembles, or dynamic model loading/unloading, its capabilities may be less developed compared to Triton.
- Lack of Dynamic Batching: While ONNX Runtime supports static batching, dynamic batching, which automatically combines requests for maximum GPU utilization, is absent or implemented less efficiently than in Triton.
Who it's suitable for:
ONNX Runtime Inference Server is an excellent fit for projects where ONNX is already used for model unification, or where high performance is required on various hardware platforms (including edge devices). It's a good choice to replace a "raw" API when a higher level of optimization is needed without the complexity of Triton, especially if models do not require the absolute highest possible GPU performance.
3. NVIDIA Triton Inference Server
NVIDIA Triton Inference Server (formerly TensorRT Inference Server) is a high-performance, open-source inference server developed by NVIDIA for deploying machine learning models in production. It is designed to maximize GPU resource utilization while ensuring low latency and high throughput.
Pros:
- Maximum GPU Performance: Triton is developed by NVIDIA and deeply integrated with CUDA, TensorRT, and other low-level optimizations. It offers dynamic batching, model and request parallelism, and multi-GPU inference, allowing for unprecedented GPU utilization.
- Broad Framework Support: Supports TensorFlow, PyTorch, ONNX, TensorRT, OpenVINO, Scikit-learn, XGBoost, and can be extended with custom backends.
- Configuration Flexibility: Allows fine-tuning of server behavior for each model, including batch size, number of model instances, scheduling policies, and memory management.
- Multi-Model Inference: Capable of simultaneously serving multiple models, efficiently distributing GPU resources among them.
- Dynamic Model Loading/Unloading: Allows models to be updated without restarting the server, which is critical for production.
- Built-in Metrics: Provides extensive Prometheus metrics for monitoring performance and resource utilization.
Cons:
- Learning Curve: Configuring Triton can be complex, especially for new users, due to the abundance of options and the need to understand concepts such as backends, model repositories, and scheduling policies.
- Infrastructure Requirements: Fully realizing Triton's potential often requires deployment in Kubernetes, which adds its own layer of complexity.
- NVIDIA Dependency: While there is support for CPU and other GPUs, maximum performance is achieved on NVIDIA hardware, which can be a limitation for some projects.
- CPU Overhead: For a very large number of models or complex scheduling, Triton can consume significant CPU resources.
Who it's suitable for:
Triton Inference Server is an ideal choice for companies working with high-load AI applications that require maximum performance, low latency, and high throughput. This includes large SaaS projects, projects in autonomous driving, computer vision, real-time natural language processing, and any scenario where the cost-effectiveness of GPU utilization is a priority.
4. KServe / Seldon Core (on Kubernetes)
KServe (formerly KFServing) and Seldon Core are frameworks for deploying machine learning models on Kubernetes. They provide high-level abstractions for model serving, including autoscaling, versioning, A/B testing, and canary deployments. Under the hood, they can utilize other inference servers such as Triton, TensorFlow Serving, PyTorch Serve, or ONNX Runtime Server.
Pros:
- Powerful MLOps Capabilities: Provide comprehensive features for managing the model lifecycle, including versioning, A/B testing, canary deployments, and autoscaling.
- Automatic Scaling: Automatically scales model instances based on load, including scale-to-zero for resource savings during idle periods.
- Deployment Standardization: Unify the deployment process for ML models in Kubernetes, regardless of the framework or inference server used.
- High Availability and Fault Tolerance: Utilize built-in Kubernetes mechanisms to ensure high availability and self-healing.
- Integration with Kubernetes Ecosystem: Easily integrate with other Kubernetes services, such as Istio (for traffic routing) and Prometheus/Grafana (for monitoring).
Cons:
- High Complexity: Require deep knowledge of Kubernetes and related technologies. Deploying and managing such an infrastructure can be very complex and resource-intensive.
- Kubernetes Overhead: The Kubernetes platform itself and its components (control plane, Kube-proxy, Ingress controllers) add overhead for CPU, memory, and network.
- Additional Abstraction Layer: While abstraction is convenient, it can hide low-level optimization details, making fine-tuning performance difficult.
- Cold Start Latency: When scaling to zero, the first request to a "cold" model can have significantly higher latency due to the time required to launch a new pod.
Who it's suitable for:
KServe and Seldon Core are ideal for large organizations and teams that already actively use Kubernetes for their infrastructure and have experience with it. They are indispensable for MLOps teams managing a large number of models requiring complex deployment strategies (A/B, canary) and automatic scaling. This is a solution for those willing to invest in complex infrastructure for high automation and reliability at scale.
Practical Tips and Recommendations for Optimizing Inference with Triton Inference Server
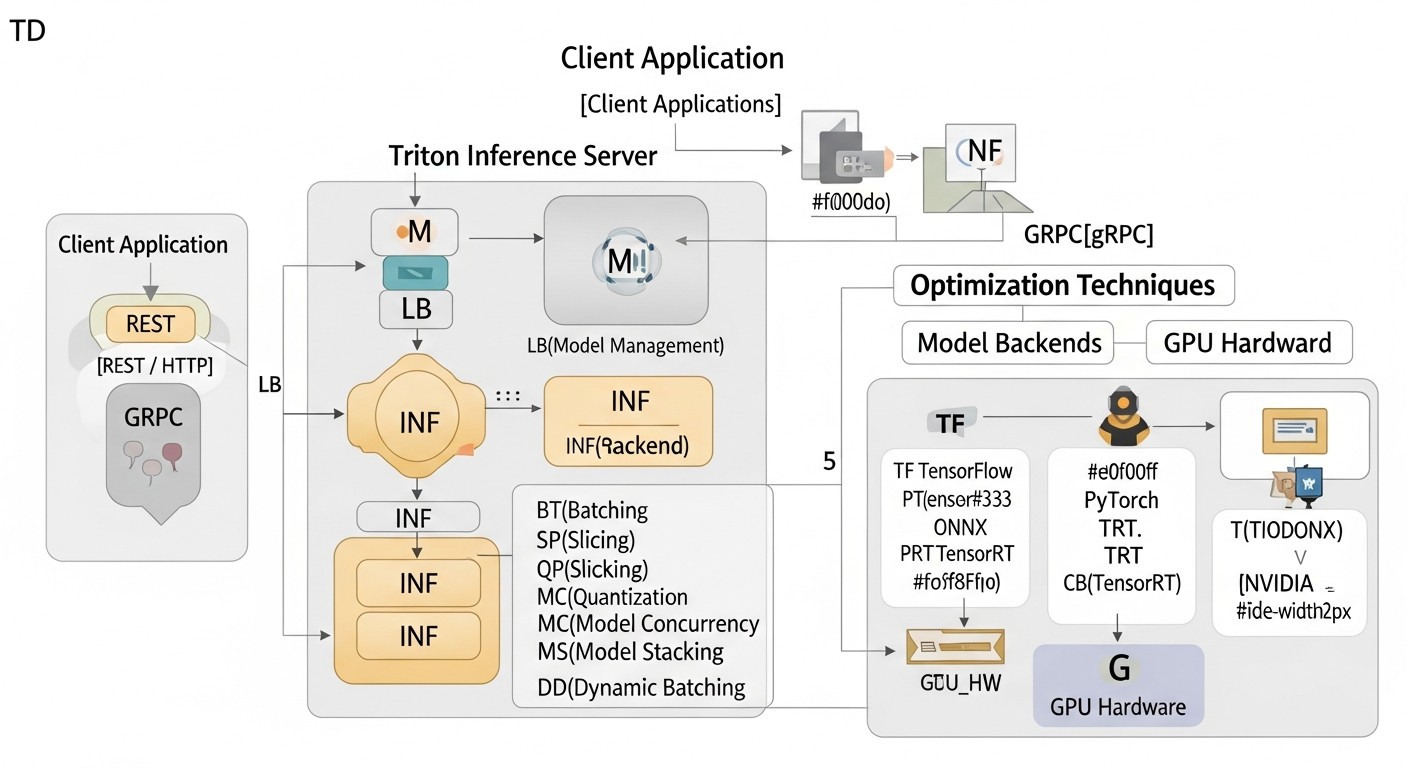 Diagram: Practical Tips and Recommendations for Optimizing Inference with Triton Inference Server
In this section, we will focus on specific steps and configurations that will help you achieve maximum performance and efficiency when using Triton Inference Server.
1. GPU Hardware Selection and Optimization (2026)
The correct GPU selection is fundamental. In 2026, the market offers the following key options:
- NVIDIA Blackwell (B200/GB200): These GPUs are the flagships for AI, offering unprecedented computational power, especially for FP8 and FP16 computations. They are ideal for the most demanding and largest models.
- NVIDIA H200/H100: The previous Hopper generation, still very powerful and cost-effective for many tasks. The H200 with increased memory (141 GB HBM3e) is especially good for large models.
- AMD Instinct MI400-series: Competing solutions from AMD that can offer better cost/performance in some scenarios, especially if your ecosystem is already oriented towards ROCm.
- NVIDIA L40S/L4: For more economical or less demanding scenarios where extreme HBM memory performance is not needed, but density and energy efficiency are important.
Recommendations:
- For models requiring maximum throughput and minimal latency, especially for LLMs and multimodal models, invest in NVIDIA Blackwell B200/GB200. They offer specialized blocks for FP8 and FP16, as well as improved NVLink interconnect.
- For large models (LLMs) with moderate load, where memory size is important, NVIDIA H200 will be the optimal choice.
- For budget-friendly or less demanding tasks, consider NVIDIA L40S or L4, which offer an excellent price/performance ratio for inference.
- Use NVLink: If you are deploying multiple GPUs on a single server, ensure they are connected via NVLink. This will significantly speed up data transfer between GPUs and allow for more efficient use in Triton's multi-GPU configurations.
2. Model Optimization for Inference
The most powerful inference server will not help if the model is not optimized.
- Quantization:
Transitioning from FP32 to FP16 (half-precision), INT8 (integer precision), or even FP8 (in Blackwell GPUs) significantly reduces model size and computation volume, improving latency and throughput. For LLMs, 4-bit quantization (GPTQ, AWQ) is becoming standard.
import torch
from transformers import AutoModelForCausalLM, AutoTokenizer
from accelerate import init_empty_weights, load_checkpoint_and_dispatch
from optimum.gptq import GPTQQuantizer, load_quantized_model_from_config

# Пример квантизации для LLM (GPTQ)
model_id = "meta-llama/Llama-2-7b-hf"
quantizer = GPTQQuantizer(bits=4, dataset="wikitext2", model_seqlen=2048)
model_quant = quantizer.quantize_model(model_id, save_dir="llama-2-7b-4bit-gptq")

# Или использование уже квантованной модели
model = load_quantized_model_from_config("llama-2-7b-4bit-gptq")
Recommendation: Always aim for the most aggressive quantization (INT8, FP8, 4-bit) that does not lead to unacceptable model quality degradation. For this, use QAT (Quantization Aware Training) or PTQ (Post-Training Quantization) methods.
- Compilation with TensorRT:
NVIDIA TensorRT is an SDK for high-performance inference that optimizes neural networks for NVIDIA GPUs. It performs graph optimizations, selects optimal CUDA kernels, and can automatically quantize models. Triton has built-in support for the TensorRT backend.
# Пример конфигурации модели для Triton с TensorRT бэкендом
# model.json в директории модели:
# {
#   "name": "my_tensorrt_model",
#   "platform": "tensorrt_plan", # или tensorrt_onnx
#   "input": [ ... ],
#   "output": [ ... ],
#   "default_model_filename": "model.plan"
# }
# Конвертация ONNX в TensorRT PLAN
trtexec --onnx=model.onnx --saveEngine=model.plan --fp16 # или --int8
Recommendation: For all models on NVIDIA GPUs, where possible, convert them to TensorRT PLAN files. This will provide the greatest performance boost. Use trtexec for compilation and testing.
- ONNX:
Converting models to ONNX format and further optimizing them with ONNX Runtime or TensorRT (via the ONNX-TensorRT backend in Triton) also significantly improves performance.
3. Triton Inference Server Configuration
Key configuration parameters affecting performance:
- Dynamic Batching:
Allows Triton to combine multiple incoming requests into a single batch for GPU inference. This significantly increases GPU utilization, as GPUs process larger data batches more efficiently. Configured in the model's config.pbtxt.
# config.pbtxt для модели
dynamic_batching {
  max_queue_delay_microseconds: 100000 # Максимальная задержка очереди в 100 мс
  preferred_batch_size: [ 4, 8, 16 ] # Предпочтительные размеры пакетов
  max_batch_size: 32 # Максимальный размер пакета
}
Recommendation: Experiment with max_queue_delay_microseconds and preferred_batch_size. Too large a delay will increase latency, too small a delay will decrease throughput. Optimal values depend on the model and workload.
- Model Parallelism (Instance Groups):
Allows running multiple copies (instances) of a single model on one or more GPUs. This is useful for increasing throughput, especially if a single model instance cannot fully load the GPU.
# config.pbtxt для модели
instance_group [
  {
    kind: KIND_GPU
    count: 2 # Запустить 2 инстанса модели на каждом GPU
    gpus: [ 0, 1 ] # Использовать GPU 0 и 1
  }
]
Recommendation: Start with count: 1. If GPU utilization is low, increase count until you reach 90%+ utilization or encounter latency degradation.
- Schedulers:
Triton offers various schedulers for managing requests. Default (Sequence Batcher) is suitable for most cases. For stateful models (RNN, LLM with history), use Sequence Batcher.
# config.pbtxt для stateful модели
sequence_batching {
  max_sequence_idle_microseconds: 5000000 # 5 секунд
  state_input {
    name: "STATE_IN"
    data_type: TYPE_FP32
    dims: [ 1024 ]
  }
  state_output {
    name: "STATE_OUT"
    data_type: TYPE_FP32
    dims: [ 1024 ]
  }
}
Recommendation: Carefully configure max_sequence_idle_microseconds for stateful models to balance between context preservation and resource release.
- Model Caching:
Triton supports caching models in GPU memory, allowing quick switching between them without reloading. For large LLMs that occupy all GPU memory, this might not be relevant, but for smaller models used in ensembles, it is critical.
4. Deployment in Kubernetes (with KServe/Seldon Core)
For production environments, Kubernetes is the standard. Integrating Triton with KServe or Seldon Core simplifies management.
- Using Helm Charts:
For quick Triton deployment, use the official NVIDIA Helm chart.
helm repo add nvdp https://helm.ngc.nvidia.com/nvidia
helm repo update
helm install triton nvdp/triton-inference-server \
  --namespace triton \
  --create-namespace \
  --set replicaCount=1 \
  --set modelRepository.pv.enabled=true \
  --set modelRepository.pv.size=50Gi \
  --set service.type=LoadBalancer \
  --set gpu.enabled=true \
  --set nvidia.driver.enabled=false # Предполагаем, что драйверы уже установлены
- Integration with KServe:
KServe allows deploying Triton as one of the supported runtimes. Example KServe InferenceService for Triton:
apiVersion: "serving.kserve.io/v1beta1"
kind: "InferenceService"
metadata:
  name: "my-triton-model"
spec:
  predictor:
    triton:
      protocolVersion: v2 # Или v1
      storageUri: "s3://my-model-bucket/models/my-triton-model"
      resources:
        limits:
          nvidia.com/gpu: "1" # Запросить 1 GPU
          memory: "32Gi"
        requests:
          nvidia.com/gpu: "1"
          memory: "32Gi"
      # Можно также указать image: "nvcr.io/nvidia/tritonserver:23.09-py3"
Recommendation: Use KServe for abstraction and automation. Ensure you have the NVIDIA GPU Operator installed in Kubernetes for correct GPU operation.
5. Monitoring and Profiling
Without monitoring, it's impossible to understand what's happening with your inference.
- Prometheus and Grafana:
Triton provides metrics in Prometheus format. Configure Prometheus to collect these metrics and Grafana for visualization. Key metrics:
nv_gpu_utilization: GPU Utilizationnv_gpu_memory_used_bytes: GPU Memory Usagenv_inference_request_duration_us: Request Latencynv_inference_request_count: Request Countnv_inference_queue_duration_us: Dynamic Batching Queue Time
- NVIDIA DCGM Exporter:
For more detailed GPU monitoring, use DCGM Exporter, which provides GPU metrics at the hardware level.
# Пример развертывания DCGM Exporter в Kubernetes
kubectl apply -f https://raw.githubusercontent.com/NVIDIA/gpu-operator/master/deployments/cluster-monitoring/dcgm-exporter.yaml
- Profiling with Nsight Systems/Nsight Compute:
For in-depth performance analysis of individual models or backends, use NVIDIA Nsight Systems and Nsight Compute tools. They help identify bottlenecks at the level of CUDA kernels, memory operations, and inter-process communication.
# Запуск Triton с Nsight Systems для профилирования
nsys profile --output my_triton_profile --duration 60 \
  tritonserver --model-repository=/models
Recommendation: Always have a configured monitoring stack. Use alerts for critical metrics (e.g., high latency, low GPU utilization, errors). Regularly perform profiling to identify hidden bottlenecks.
Typical Mistakes When Deploying High-Performance AI/ML Inference and How to Avoid Them
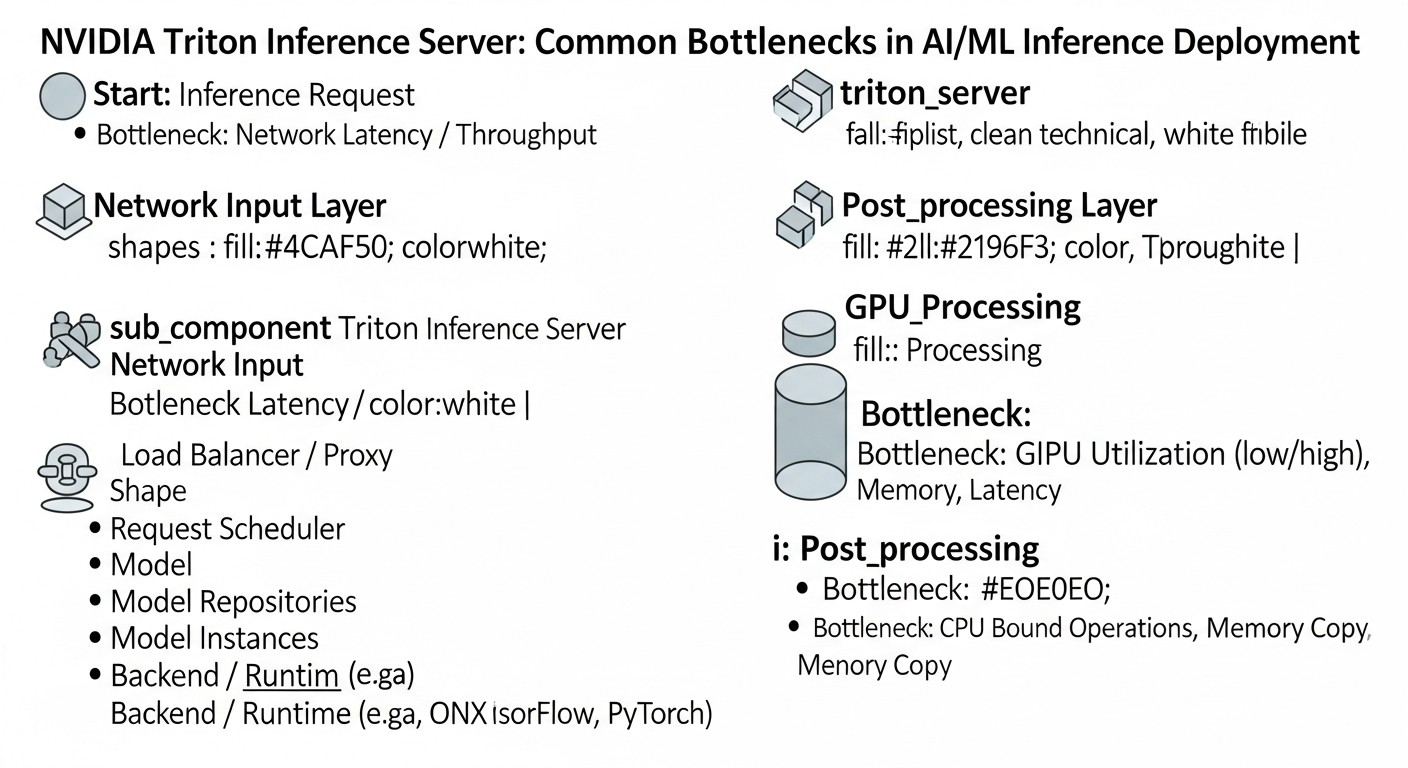 Diagram: Typical mistakes when deploying high-performance AI/ML inference and how to avoid them
Even experienced teams encounter pitfalls when optimizing inference. Knowing these mistakes will help avoid costly problems.
1. Ignoring Model Optimization Before Deployment
Mistake: Deploying "raw" models (e.g., in FP32 PyTorch or TensorFlow) without any optimization (quantization, TensorRT compilation). Many believe that a powerful GPU and Triton alone will solve all problems.
Consequences: Extremely low performance, high latency, huge GPU costs, as the model does not use it efficiently. The GPU may be loaded at 20-30% of its full computational power.
How to avoid:
- Always start with model optimization. Quantization (INT8, FP8, 4-bit) and compilation (TensorRT, OpenVINO) should be the first steps.
- Use profilers (Nsight Systems) to evaluate model performance before loading it into Triton.
- Include optimization in your MLOps pipeline so that each new model version automatically goes through the optimization stage.
2. Incorrect Dynamic Batching Configuration
Mistake: Setting max_queue_delay_microseconds too small or max_batch_size too large without considering model characteristics and expected load.
Consequences:
- Too small
max_queue_delay_microseconds: Low GPU utilization, as Triton does not have time to collect enough requests into a batch, leading to processing small batches.
- Too large
max_batch_size: Increased latency for individual requests waiting for a full batch to be assembled. Can also lead to OOM (Out Of Memory) errors on the GPU.
How to avoid:
- Thoroughly test dynamic batching under realistic load. Start with small
preferred_batch_size and max_batch_size, gradually increasing them.
- Monitor
nv_inference_queue_duration_us and nv_inference_compute_duration_us metrics, as well as GPU utilization. Look for a balance between latency and throughput.
- Use
concurrency_limit in config.pbtxt to prevent GPU overload and avoid OOM.
3. Lack of Adequate Monitoring
Mistake: Deploying Triton without configured Prometheus/Grafana or other monitoring systems.
Consequences: Inability to identify performance bottlenecks, understand reasons for service degradation, optimize resource usage, or react to failures. You will be "flying blind".
How to avoid:
- From the outset, implement a standard monitoring stack (Prometheus, Grafana).
- Use NVIDIA DCGM Exporter for deep GPU monitoring.
- Configure alerts for key metrics: GPU utilization, request latency, number of errors.
4. Incorrect GPU Memory Management (OOM Errors)
Mistake: Loading too many models or model instances onto a single GPU, leading to GPU memory overflow.
Consequences: Inference failures, Triton pod restarts, unstable service operation, loss of request data.
How to avoid:
- Accurately know the memory consumed by each model. Use
nvidia-smi or DCGM for monitoring.
- Use
instance_group with the count parameter to control the number of model instances per GPU.
- In Kubernetes, set adequate
resources.limits.nvidia.com/gpu and resources.limits.memory for Triton pods.
- Consider splitting large models across multiple GPUs (model parallelism) or using techniques such as offloading layers to the CPU, if possible.
5. Underestimating the Complexity of Deployment in Kubernetes
Mistake: Assuming that deploying Triton in Kubernetes will be as simple as running a Docker container.
Consequences: Long deployment delays, issues with network configuration, access to model storage, integration with GPU drivers, scaling, and monitoring. Inefficient use of cluster resources.
How to avoid:
- Invest in Kubernetes team training.
- Use official NVIDIA Helm charts for Triton and NVIDIA GPU Operator for managing GPU drivers.
- Configure Persistent Volumes for the Model Repository.
- Configure an Ingress controller and Service Mesh (e.g., Istio) for traffic management and A/B testing.
6. Ignoring Model Versioning and A/B Testing
Mistake: Directly replacing an old model with a new version without testing on a portion of the traffic.
Consequences: Degradation of inference quality, discovered only after full deployment, which can lead to significant business losses and reputational risks.
How to avoid:
- Use Triton's model versioning capabilities (different subdirectories in the repository).
- Apply Kubernetes operators, such as KServe or Seldon Core, which provide built-in mechanisms for canary deployments and A/B testing.
- Always test new model versions on a small percentage of real traffic before full deployment.
7. Lack of a "Cold Start" Strategy
Mistake: When using auto-scaling to zero (scale-to-zero), the time required to start a pod and load the model on the first request is not taken into account.
Consequences: Very high latency for the first requests after a period of inactivity, which is unacceptable for many real-time applications.
How to avoid:
- Use pre-provisioned replicas (min replicas > 0) for critical models to avoid cold start.
- For less critical models, optimize model loading time (e.g., using TensorRT, reducing model size).
- Consider using "warm-up" requests after a new instance starts.
- In KServe, configure
minReplicas to maintain a minimum number of running pods.
Checklist for Practical Application of Triton Inference Server
This checklist will help you systematize the process of deploying and optimizing AI/ML inference using Triton Inference Server.
- Model Preparation:
- [ ] Model format (PyTorch, TensorFlow, ONNX) selected and fixed.
- [ ] Model trained and validated on test data.
- [ ] Model's input and output tensors, their data types, and dimensions are defined.
- Model Optimization:
- [ ] Model quantized (FP16, INT8, FP8, 4-bit) to the maximum possible extent without unacceptable quality degradation.
- [ ] Model converted to ONNX format (if not used directly in PyTorch/TF).
- [ ] Model compiled using NVIDIA TensorRT (for NVIDIA GPUs), if applicable.
- [ ] Performance of the optimized model checked locally (e.g., with
trtexec).
- Hardware Selection:
- [ ] GPU type (NVIDIA B200/H200/L40S or AMD MI400) determined based on performance requirements and budget.
- [ ] If on-premise, compatible GPU drivers and CUDA are ensured.
- [ ] If in the cloud, a suitable GPU instance is selected.
- Model Repository Configuration:
- [ ] Directory structure for models created (
model_repository/model_name/version_number/).
- [ ] Models placed in appropriate directories.
- [ ] For each model,
config.pbtxt created with descriptions of input/output tensors, backend, and other parameters.
- Triton Inference Server Configuration:
- [ ] Dynamic batching (
dynamic_batching) configured in config.pbtxt for each model.
- [ ] Instance groups (
instance_group) configured for each model to efficiently use the GPU.
- [ ]
sequence_batching configured for stateful models.
- [ ] Appropriate backend selected for each model (TensorRT, ONNXRuntime, PyTorch, TensorFlow, etc.).
- Triton Deployment (Docker/Kubernetes):
- [ ] Suitable Triton Server Docker image selected (e.g.,
nvcr.io/nvidia/tritonserver:23.09-py3).
- [ ] If Docker is used, the
docker run --gpus all ... command is configured correctly.
- [ ] If Kubernetes is used:
- [ ] NVIDIA GPU Operator installed.
- [ ] Helm chart used for Triton deployment or KServe/Seldon Core.
- [ ] Persistent Volumes configured for Model Repository.
- [ ]
resource requests/limits for GPU and memory defined in pod manifests.
- Network and Access Configuration:
- [ ] Ports for Triton HTTP/gRPC API (8000/8001) and metrics (8002) defined.
- [ ] Ingress controller (for Kubernetes) or load balancer configured for Triton access.
- [ ] Security ensured: TLS/SSL, authentication/authorization (if required).
- Monitoring and Logging:
- [ ] Prometheus configured for collecting Triton and DCGM Exporter metrics.
- [ ] Grafana configured for metric visualization and dashboard creation.
- [ ] Alerts configured for key performance indicators and errors.
- [ ] Centralized logging (ELK Stack, Loki) configured for collecting Triton logs.
- Performance Testing:
- [ ] Load testing conducted using tools (Locust, JMeter, K6) to evaluate latency and throughput.
- [ ] GPU utilization checked under load.
- [ ] A/B testing conducted (if applicable) for new model versions.
- Backup and Recovery:
- [ ] Model Repository backup strategy developed.
- [ ] Service recovery capability after a failure checked.
Cost Calculation and Economics of High-Performance GPU Inference (2026)
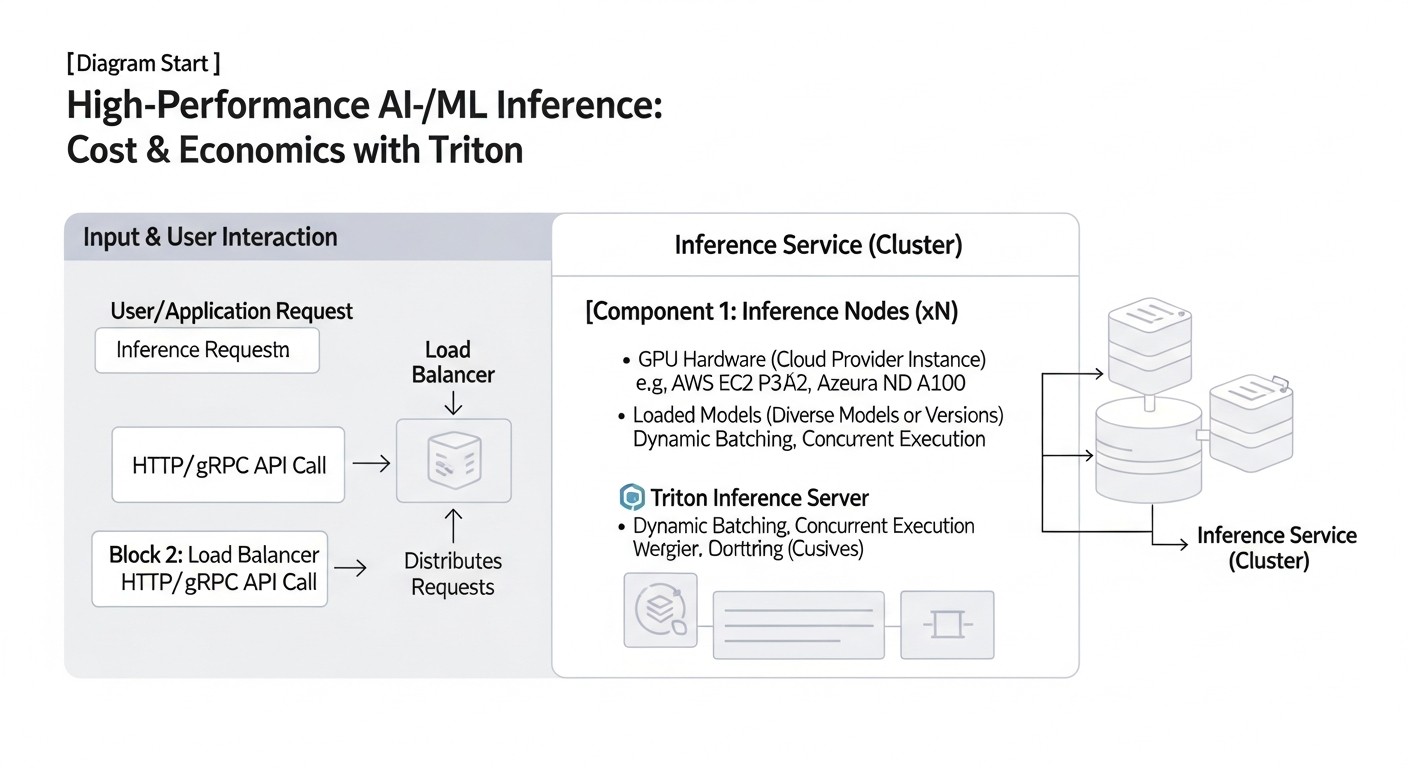 Diagram: Cost Calculation and Economics of High-Performance GPU Inference (2026)
The economic efficiency of inference is not just the cost of a GPU, but a combination of factors, including utilization, engineering costs, power consumption, and potential hidden expenses. In 2026, as GPU infrastructure becomes even more expensive and powerful, cost optimization is critically important.
Calculation Examples for Different Scenarios (2026)
Let's consider hypothetical scenarios to estimate inference costs, using cloud GPU instance prices relevant for 2026 (assuming average prices for NVIDIA H200 and Blackwell B200 from major cloud providers).
Scenario 1: Small Startup with Moderate Load
- Model: Small CV model (e.g., ResNet-50), optimized (INT8/FP16).
- Requirements: 100 requests per second (RPS) at peak, average latency up to 50 ms.
- Hardware: 1x NVIDIA L40S GPU (or equivalent) in the cloud.
- L40S Cost: ~$1.50/hour (constant load, no discounts).
- Model Performance on L40S: Up to 500-800 RPS for FP16/INT8.
- GPU Utilization: ~15-20% at 100 RPS.
- Calculation:
- Monthly Cost: 1.50 $/hour * 24 hours/day * 30 days/month = 1080 $
- Cost per 1 Million Inferences: (1080 $ / (100 RPS * 3600 sec/hour * 24 hours/day * 30 days/month)) * 1,000,000 = (1080 $ / 259,200,000) * 1,000,000 = ~$4.17 per 1 million inferences.
Conclusion: Even with moderate load, the GPU can be severely underutilized. It's important to use Triton for maximum load, even if one GPU seems like too much. Here, it might be worth considering scale-to-zero or using spot instances.
Scenario 2: Medium SaaS Project with High Load
- Model: Medium-sized LLM (7B-13B parameters), 4-bit quantization, TensorRT.
- Requirements: 500 requests per second (RPS) at peak, average latency up to 100 ms.
- Hardware: 2x NVIDIA H200 GPU instances (each with 1 GPU) in the cloud.
- H200 Cost: ~$4.50/hour per instance (constant load).
- Model Performance on H200: ~300-400 RPS for 4-bit LLM.
- GPU Utilization: ~70-80% on each GPU (with Triton).
- Calculation:
- Monthly Cost (2 instances): 2 * 4.50 $/hour * 24 hours/day * 30 days/month = 6480 $
- Total Throughput: 2 * 350 RPS = 700 RPS (with buffer).
- Cost per 1 Million Inferences: (6480 $ / (700 RPS * 3600 sec/hour * 24 hours/day * 30 days/month)) * 1,000,000 = (6480 $ / 1,814,400,000) * 1,000,000 = ~$3.57 per 1 million inferences.
Conclusion: Thanks to Triton and optimization, GPU utilization is significantly higher, which reduces the cost per inference. Scaling to 2 GPUs allows handling peak load.
Scenario 3: Large Enterprise with Extreme Load and Large Models
- Model: SOTA LLM (70B+ parameters), FP8/FP16, TensorRT.
- Requirements: 2000 requests per second (RPS) at peak, average latency up to 200 ms.
- Hardware: 4x NVIDIA Blackwell B200 GPU instances (each with 1 GPU) in the cloud.
- B200 Cost: ~$8.00/hour per instance (constant load).
- Model Performance on B200: ~600-700 RPS for FP8 LLM.
- GPU Utilization: ~85-95% on each GPU (with Triton).
- Calculation:
- Monthly Cost (4 instances): 4 * 8.00 $/hour * 24 hours/day * 30 days/month = 23040 $
- Total Throughput: 4 * 650 RPS = 2600 RPS (with buffer).
- Cost per 1 Million Inferences: (23040 $ / (2600 RPS * 3600 sec/hour * 24 hours/day * 30 days/month)) * 1,000,000 = (23040 $ / 6,739,200,000) * 1,000,000 = ~$3.42 per 1 million inferences.
Conclusion: Despite the high cost of B200, their performance and optimization with Triton allow achieving a very low cost per inference at large scales, thanks to high utilization and specialized FP8 capabilities.
Hidden Costs
- Data Traffic: Transferring large volumes of data (input/output tensors) between the client and server, as well as between cloud regions, can be costly.
- Model Storage: Cost of S3-compatible storage for the model repository.
- CPU Resources: Triton consumes CPU for request management, dynamic batching, and other overheads. Kubernetes, KServe/Seldon Core also require significant CPU resources.
- Monitoring and Logging: Cost of storing Prometheus metrics and logs.
- Licenses: Some specialized tools or backends may require licenses.
- Engineering Time: The biggest hidden cost. Time spent on setting up, optimizing, debugging, and supporting the inference infrastructure.
- Power Consumption and Cooling (for on-premise): Significant expenses for proprietary data centers.
How to Optimize Costs
- Maximum GPU Utilization:
- Use Triton Inference Server with dynamic batching and model parallelism.
- Combine multiple models on a single GPU, if possible.
- Monitor GPU utilization and scale resources accordingly.
- Aggressive Model Optimization:
- Quantize models to INT8/FP8/4-bit.
- Use TensorRT for compilation.
- Reduce model size if it doesn't compromise quality.
- Efficient Scaling:
- Use autoscaling (HPA in Kubernetes) to dynamically add/remove GPU instances.
- Consider scale-to-zero for models with intermittent load, but account for cold starts.
- Use spot/preemptible instances in the cloud for non-critical tasks or as additional capacity, but be prepared for their sudden termination.
- Choosing the Right GPU Instance:
- The most powerful GPU is not always the best choice. Select a GPU that matches your model's requirements and workload.
- Compare offerings from different cloud providers, as prices can vary significantly.
- Network Traffic Optimization:
- Compress input and output data.
- Locate the inference server as close as possible to clients or data sources.
- Model Lifecycle Management:
- Regularly retrain and optimize models to keep them relevant and efficient.
- Remove unused or outdated models.
Table with Calculation Examples for Different Scenarios
| Parameter |
Scenario 1 (Startup) |
Scenario 2 (SaaS Project) |
Scenario 3 (Enterprise) |
| Model Type |
CV (ResNet-50) |
LLM (7B-13B) |
LLM (70B+) |
| Optimization |
INT8/FP16 |
4-bit Quantization, TensorRT |
FP8/FP16, TensorRT |
| Peak Load (RPS) |
100 |
500 |
2000 |
| Required Latency (ms) |
50 |
100 |
200 |
| GPU Instance (2026) |
1x L40S |
2x H200 |
4x B200 |
| Approximate GPU Cost/Hour |
$1.50 |
$4.50 (for H200) |
$8.00 (for B200) |
| Monthly GPU Cost (constant) |
$1,080 |
$6,480 |
$23,040 |
| Average GPU Utilization |
15-20% |
70-80% |
85-95% |
| Cost per 1 Million Inferences |
~$4.17 |
~$3.57 |
~$3.42 |
Real-World Cases and Examples
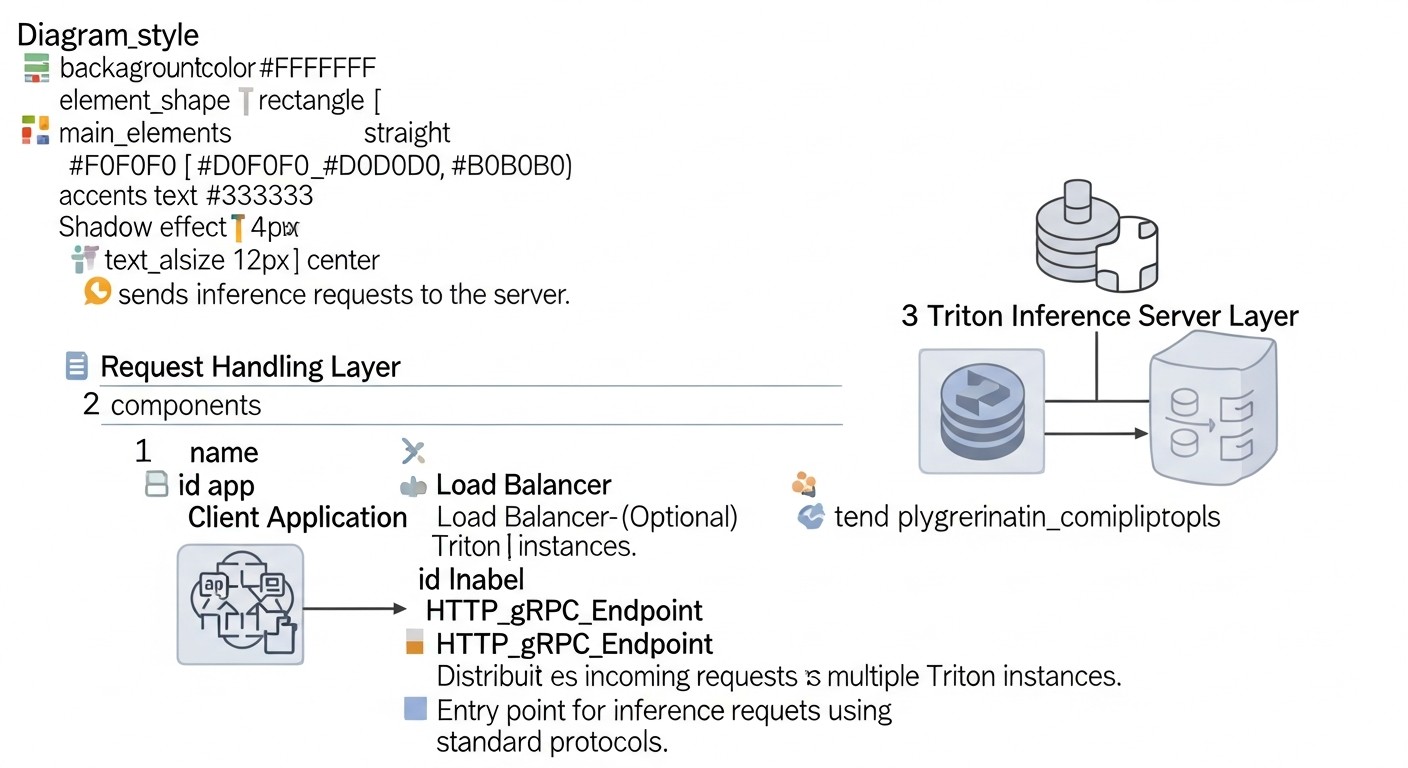 Diagram: Real-World Cases and Examples
Theory is important, but real-world cases demonstrate how principles are applied in practice and what results can be achieved.
Case 1: Inference Optimization for a Real-time Recommendation System
Company: A large e-commerce retailer serving millions of users daily.
Problem: The existing recommendation system, based on PyTorch models, was slow. Each recommendation required multiple inferences, leading to a latency of 300-500 ms. Throughput was only about 100 RPS per GPU, which demanded a large number of expensive instances. Models were deployed as separate FastAPI services.
Solution:
- Model Consolidation: All recommendation models were migrated to Triton Inference Server.
- Model Optimization: Each model was quantized to FP16 and then compiled into a TensorRT PLAN file.
- Triton Configuration:
- Dynamic batching was enabled with
max_queue_delay_microseconds: 50000 (50 ms) and preferred_batch_size: [8, 16, 32].
- For each model,
instance_group was configured with count: 2 per GPU to maximize utilization.
- Infrastructure: Deployed on Kubernetes using KServe, which enabled autoscaling and A/B testing of new model versions. NVIDIA H100 GPUs were used.
Results:
- Latency: Reduced to 80-120 ms (p95), which improved user experience and conversion.
- Throughput: Increased to 1200-1500 RPS on a single H100 GPU (12-15 times compared to the original).
- Cost: GPU infrastructure costs were reduced by 60% due to a significant increase in utilization and a decrease in the number of required instances.
- Management: Model management was simplified thanks to KServe and a centralized Triton repository.
Case 2: Deploying a Multimodal LLM for Content Generation
Company: An AI content generation startup using a large multimodal model (text-image) with 20B parameters.
Problem: The model was very large and slow. Loading into memory took several minutes, and a single inference lasted 5-10 seconds on one GPU. The company could not scale due to huge GPU costs and low throughput. Cloud instances with NVIDIA A100 were used.
Solution:
- Hardware Selection (2026): Transition to instances with NVIDIA Blackwell B200 GPUs, which offer specialized cores for FP8 and increased HBM memory.
- Model Optimization:
- The model was thoroughly optimized: 8-bit quantization (FP8) was applied for computations and partial 4-bit for weights.
- Fully compiled into a TensorRT PLAN file.
- Triton Configuration:
- TensorRT backend was used in Triton.
- Dynamic batching was configured with
max_queue_delay_microseconds: 200000 (200 ms) and preferred_batch_size: [1, 2, 4], as latency was less critical than throughput.
model_ensemble was used to combine the text and image components of the model into a single inference pipeline within Triton.instance_group was configured with count: 1 per B200, as the model occupied almost all GPU memory.
- Infrastructure: Deployed on Kubernetes using Seldon Core for deployment management and monitoring.
Results:
- Inference Time: Reduced from 5-10 seconds to 800-1500 ms on a B200 GPU.
- Throughput: Increased to 600-700 RPS on a single B200 GPU (compared to 10 RPS on an A100).
- Cost: Despite the more expensive B200s, the total cost of inference per unit of content decreased by 40% due to a massive increase in throughput and utilization.
- Scalability: The startup was able to serve significantly more clients and expand its offerings.
Case 3: Inference for Edge Devices with Centralized Management
Company: A manufacturer of smart surveillance cameras, using AI for object detection on devices.
Problem: Tens of thousands of cameras worldwide, each required to perform inference locally. Model updates were complex, and monitoring performance on edge devices was practically impossible. Lightweight models deployed with ONNX Runtime were used.
Solution:
- Centralized Model Repository: All models are stored in a Triton Model Repository, accessible via the cloud.
- Optimization for Edge: Models were heavily quantized (INT8) and converted to ONNX. For some devices, the OpenVINO backend of Triton was used.
- Triton on Edge: A lightweight Triton Inference Server was deployed on each edge device (without GPU, using CPU or integrated NPU/VPU supporting OpenVINO).
- Remote Management: Triton on edge devices was configured to periodically synchronize with the central Model Repository. This allowed for remote updates of models and their configurations.
- Monitoring: Triton on edge devices was configured to send key metrics (RPS, latency, errors) to a centralized monitoring system (Loki/Grafana), providing unprecedented insight into performance.
Results:
- Model Updates: The deployment time for a new model was reduced from weeks to a few hours.
- Performance: Stable and predictable performance on edge devices thanks to optimization and Triton.
- Visibility: Full control and monitoring over AI performance on tens of thousands of devices was achieved.
- Scalability: Easy addition of new devices and models to the ecosystem.
Troubleshooting: Solving Common Issues with Triton Inference Server
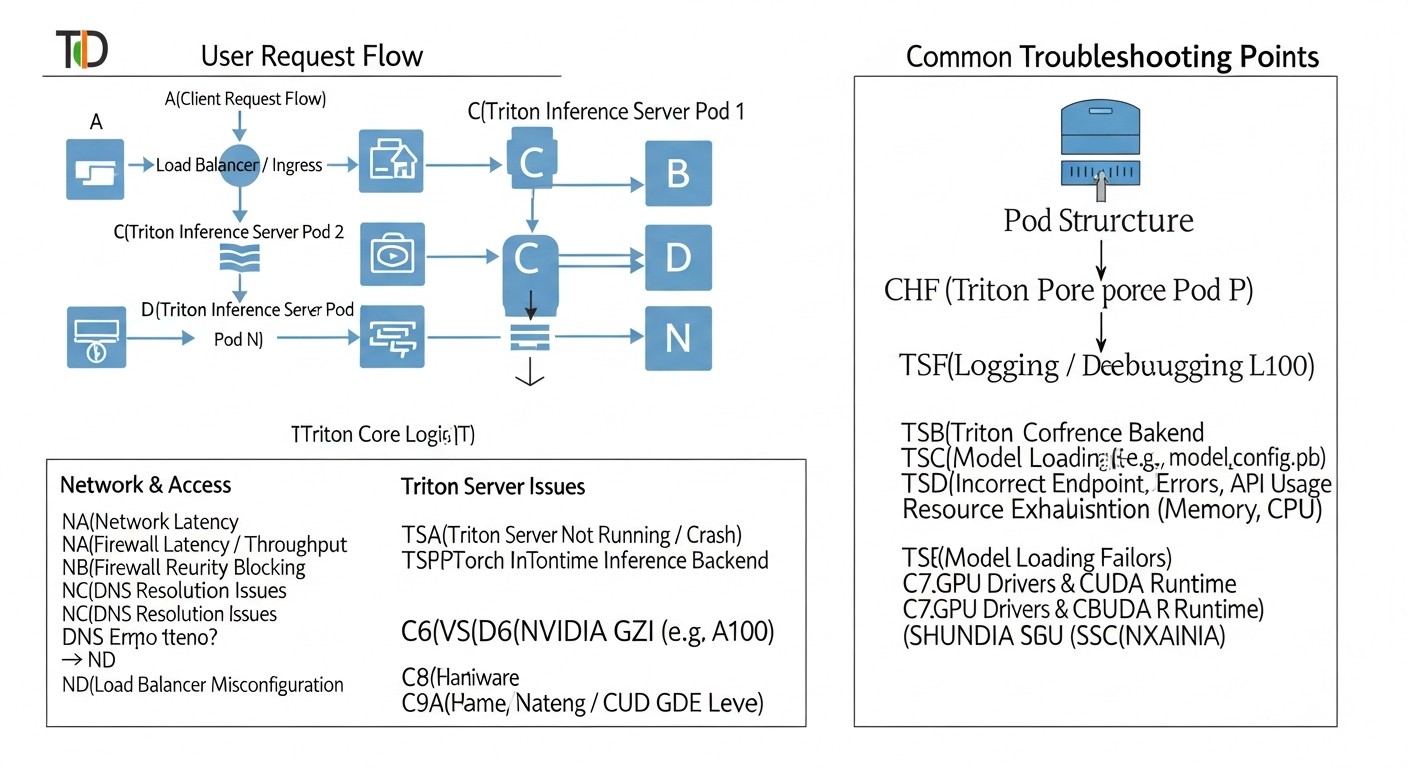 Diagram: Troubleshooting: Solving Common Issues with Triton Inference Server
Deploying high-performance inference is a complex task, and problems are inevitable. Below are common issues you might encounter and their solutions.
1. Problem: Triton Does Not Start or Load Models
Symptoms: The Triton container exits with an error, or Triton logs show that models are not loading (failed to load model).
Diagnostic Commands:
docker logs <container_id> or kubectl logs <pod_name> -n <namespace>- Check Triton's readiness status:
curl -v localhost:8000/v2/health/ready
Possible Causes and Solutions:
- Incorrect Model Repository Path: Ensure that
--model-repository points to the correct path and that Triton has access permissions.
- Errors in
config.pbtxt: Syntax errors, incorrect data types, dimensions, non-existent backends. Carefully check the model configuration.
- Backend Version Incompatibility: The model or backend requires a different framework version (TensorFlow, PyTorch) than what is installed in the Triton Docker image. Use appropriate images (e.g.,
tritonserver:23.09-tf2-py3).
- Missing GPU Drivers or CUDA: If Triton is running on a GPU, ensure that NVIDIA drivers and CUDA are installed and correctly configured. In Docker, use the
--gpus all flag. In Kubernetes, install the NVIDIA GPU Operator.
- Insufficient Memory (RAM/GPU): The model is too large for the available memory. Check logs for OOM errors. Reduce the number of model instances or use a GPU with more memory.
2. Problem: Low Performance (High Latency, Low Throughput)
Symptoms: Requests are processed slowly, GPU utilization is low, even under load.
Diagnostic Commands:
- Monitor Prometheus/Grafana metrics (
nv_gpu_utilization, nv_inference_request_duration_us, nv_inference_queue_duration_us).
- Use
perf_analyzer for load testing.
- Profiling with Nsight Systems.
Possible Causes and Solutions:
- Unoptimized Model: The most common cause. Ensure the model is quantized (INT8/FP16/FP8) and compiled with TensorRT (if it's an NVIDIA GPU).
- Incorrect Dynamic Batching:
- If
nv_inference_queue_duration_us is high and nv_gpu_utilization is low: Increase max_queue_delay_microseconds so Triton has time to collect batches.
- If
nv_inference_request_duration_us is high but nv_inference_queue_duration_us is low: The model may be poorly optimized, or max_batch_size is too large for the acceptable latency.
- Insufficient Model Instances: If a single instance does not fully load the GPU, increase
count in instance_group.
- CPU Bottleneck: Triton itself or the input data preparation process can consume a lot of CPU. Monitor CPU utilization. Allocate more CPU resources for the Triton pod.
- Low I/O Throughput: Models load slowly due to slow storage. Use faster disks or caching.
3. Problem: Out Of Memory (OOM) Errors on GPU
Symptoms: Triton pods restart with errors related to insufficient GPU memory.
Diagnostic Commands:
docker logs or kubectl logs, look for CUDA out of memory or OOM messages.- Monitor
nv_gpu_memory_used_bytes in Grafana.
Possible Causes and Solutions:
- Too Many Model Instances: Reduce
count in instance_group.
max_batch_size is Too Large: Reduce the maximum batch size.- Large Model: Switch to a GPU with more memory (e.g., H200 instead of H100).
- Unoptimized Model: Quantization significantly reduces memory consumption.
- GPU Memory Fragmentation: Sometimes restarting Triton can help, but this is a temporary solution.
- Incorrect Kubernetes Limits: Ensure that
resources.limits.nvidia.com/gpu and resources.limits.memory match actual requirements.
4. Problem: Network Access Issues to Triton
Symptoms: Clients cannot connect to Triton, request timeouts.
Diagnostic Commands:
ping, telnet or nc to Triton's IP/port.kubectl describe service <triton_service>, kubectl describe ingress <triton_ingress>.- Check Ingress controller logs.
Possible Causes and Solutions:
- Incorrect Ingress/Service Configuration: Ensure that Kubernetes Service and Ingress resources correctly route traffic to Triton pods.
- Firewall: Check firewall rules on the server, in the cloud VPC, or at the Kubernetes NetworkPolicy level.
- DNS Issues: Ensure that the domain name resolves to the correct IP address.
- Incorrect Port: Ensure the client connects to the correct port (8000 for HTTP, 8001 for gRPC).
5. Problem: Model Input/Output Mismatch
Symptoms: Errors such as Input '...' has unexpected shape/data type or Output '...' has unexpected shape/data type.
Diagnostic Commands:
- Check Triton logs.
- Use Triton client to send test requests and check for errors.
Possible Causes and Solutions:
config.pbtxt Mismatch: Data types (TYPE_FP32, TYPE_INT32), dimensions (dims), or input/output tensor names in config.pbtxt do not match the model's actual requirements.- Incorrect Data Preparation on Client: The client sends data in the wrong format or size.
- Differences Between Frameworks: When converting a model (e.g., from PyTorch to ONNX), tensor names or order might have changed.
When to Contact Support
- If you encounter errors that appear to be related to Triton's or CUDA's internal mechanisms, rather than your configuration or model.
- If you have discovered a potential bug in Triton or TensorRT.
- If you cannot resolve the issue after thoroughly reviewing documentation, forums, and using diagnostic tools.
To contact support, use the NVIDIA Developer forums, the Triton GitHub repository (for bug reports), or official NVIDIA support channels if you have a relevant subscription.
FAQ: Frequently Asked Questions about Triton Inference Server
1. What is Triton Inference Server and why is it needed?
Triton Inference Server is a high-performance, open-source inference server developed by NVIDIA. It is designed for efficient deployment of machine learning models on GPUs (and CPUs) in production environments. Triton addresses issues of low GPU utilization, high latency, and low throughput by offering features such as dynamic batching, model parallelism, multi-GPU inference, and support for numerous ML frameworks. It allows for the most efficient use of expensive GPU resources.
2. Which ML frameworks does Triton support?
Triton supports a wide range of popular ML frameworks and formats, including TensorFlow (SavedModel, GraphDef), PyTorch (TorchScript), ONNX, NVIDIA TensorRT, OpenVINO, Scikit-learn, XGBoost, and even custom backends. This allows teams to use various models within a single inference server, unifying the deployment process.
3. What is the main difference between Triton and a simple FastAPI service with a model?
The main difference lies in deep optimization for GPUs and advanced inference management features. A FastAPI service requires manual implementation of dynamic batching, parallelism, and GPU memory management, which is very complex. Triton provides these features "out of the box," maximizing GPU utilization, reducing latency, and increasing throughput without significant effort from the developer.
4. What is dynamic batching and how to configure it?
Dynamic batching is a Triton mechanism that combines multiple incoming requests into a single "batch" for processing on the GPU. GPUs are much more efficient at processing large batches of data. This is configured in the model's config.pbtxt file using the dynamic_batching section, where you specify max_queue_delay_microseconds (maximum request wait time in the queue) and preferred_batch_size (preferred batch sizes).
5. How does Triton help save money?
Triton saves money by maximizing the utilization of expensive GPUs. Instead of paying for idle GPUs, Triton allows you to extract maximum performance from them, processing more requests per second on the same hardware. This reduces the number of required GPU instances, lowering cloud costs and electricity expenses (for on-premise).
6. Is Kubernetes required to work with Triton?
No, Triton can be run as a regular Docker container on any server with a GPU. However, for production environments where autoscaling, high availability, model versioning, and centralized management are important, Kubernetes becomes the de facto standard. Integrating Triton with Kubernetes via KServe or Seldon Core significantly simplifies MLOps.
7. What is TensorRT and why is it important for Triton?
TensorRT is an SDK from NVIDIA for high-performance inference that optimizes neural networks for NVIDIA GPUs. It performs graph optimizations, selects optimal CUDA kernels, and can quantize models. Triton has native support for the TensorRT backend. Using TensorRT-optimized models in Triton provides the greatest performance boost on NVIDIA GPUs.
8. How to monitor Triton's performance?
Triton provides metrics in Prometheus format, which can be collected and visualized using Prometheus and Grafana. Key metrics include GPU utilization, GPU memory usage, request latency, batching queue time, number of requests, and errors. For deeper GPU monitoring, NVIDIA DCGM Exporter can be used.
9. Can I deploy multiple models on a single GPU with Triton?
Yes, Triton supports multi-model inference. You can load multiple models onto a single Triton server, and it will efficiently distribute GPU resources among them. This is especially useful for smaller models or model ensembles, allowing for maximized GPU utilization.
10. What common mistakes should be avoided when using Triton?
The most common mistakes include: ignoring model optimization (quantization, TensorRT), incorrect dynamic batching configuration (leading to low utilization or high latency), lack of adequate monitoring, improper GPU memory management (OOM errors), and underestimating the complexity of Kubernetes deployment without proper preparation.
11. How does Triton handle requests for stateful models (e.g., LLMs with history)?
Triton provides a special sequence_batching scheduler for stateful models. It allows grouping requests belonging to a single logical sequence (e.g., a dialogue) and sending them for inference along with the model's previous state. This ensures correct context handling and allows dynamic batching to be applied even for sequential requests.
12. Can Triton be used on CPU?
Yes, Triton supports CPU inference. While its primary advantage is realized on GPUs, you can use Triton to serve models on CPUs, especially if you don't have access to GPUs or for less demanding tasks. For CPU inference, Triton also offers backends for ONNX Runtime, OpenVINO, and other CPU-optimized frameworks.
Conclusion
In the world of 2026, where AI/ML is becoming ubiquitous, the ability to efficiently deploy models on GPUs is a key competitive advantage. NVIDIA Triton Inference Server has proven itself as a powerful and flexible tool, capable of delivering unprecedented performance, low latency, and high throughput, while maximizing the utilization of expensive GPU resources.
We have discussed that success in inference optimization depends not only on the choice of the server itself but also on a whole range of factors: from the correct selection of GPUs (such as NVIDIA Blackwell B200) and aggressive model optimization (quantization, TensorRT), to thoughtful Triton configuration, integration with Kubernetes, and continuous monitoring. Ignoring any of these aspects can lead to significant overspending and an inability to meet business requirements.
The use of Triton Inference Server in conjunction with best practices such as containerization, orchestration with Kubernetes (KServe/Seldon Core), and comprehensive monitoring allows for building reliable, scalable, and cost-effective MLOps pipelines. This makes it possible not just to deploy AI models, but to do so with maximum efficiency, while ensuring the highest quality of service for end-users.
Next Steps for the Reader:
- Start small: Run Triton in Docker with one of your models, using a basic configuration.
- Optimize the model: Try quantizing your model and compiling it into TensorRT (if using NVIDIA GPUs).
- Experiment with batching: Change the dynamic batching and
instance_group parameters to see how this affects performance.
- Set up monitoring: Deploy Prometheus and Grafana to collect Triton metrics, to visualize and analyze performance.
- Learn Kubernetes: If you are not yet using Kubernetes, start learning its basics, then move on to KServe or Seldon Core for more advanced MLOps management.
- Profile: Use Nsight Systems to deeply understand the bottlenecks of your model and infrastructure.
The path to high-performance AI/ML inference requires continuous learning, experimentation, and iteration. But investments in this knowledge and these tools will pay off handsomely, providing your AI products with a competitive advantage in the rapidly changing world of 2026.